
Monetary Metals Supply and Demand Report: 3 May, 2015
For a few days early this week, it got exciting. It looked like the dollar might finally resume its collapse. The gold community was all abuzz. Was this the big gold breakout, when gold goes up and up, and gives endless profits to gold investors the way the stock market has been doing these past six years?
We put some words in italics because we think the common usage is incorrect. Gold does not go anywhere. It’s the dollar going up and down (up since 2011, but down in the long term and heading to zero soon enough). Profit is not when you trade your gold for more dollars, but when you make gold. Investing is not when you speculate on a rising price (even a real rising price, i.e. measured in gold) but when you seek to earn a yield on a productive enterprise.
The purpose of gold is not to sell.
The irony is that the price of gold will begin to skyrocket when enough people choose to own it, regardless of price (i.e. regardless of the value of the dollar, i.e. not value gold in dollars, but value dollars in gold). This will likely be the beginning of permanent gold backwardation as well.
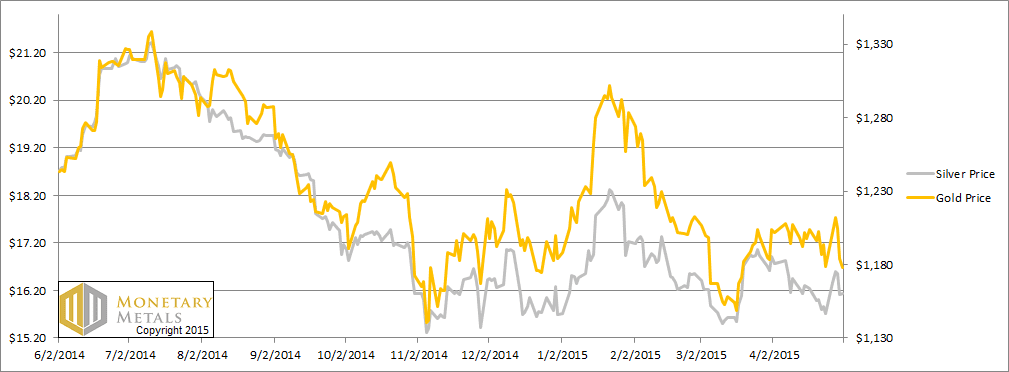
At any rate, the big gold breakout / dollar breakdown did not happen this week. The price of gold was up but then down. The price of silver was up and down too, but not as much down.
Read on to see the only accurate picture of supply and demand in the monetary metals markets…
First, here is the graph of the metals’ prices.
The Prices of Gold and Silver
We are interested in the changing equilibrium created when some market participants are accumulating hoards and others are dishoarding. Of course, what makes it exciting is that speculators can (temporarily) exaggerate or fight against the trend. The speculators are often acting on rumors, technical analysis, or partial data about flows into or out of one corner of the market. That kind of information can’t tell them whether the globe, on net, is hoarding or dishoarding.
One could point out that gold does not, on net, go into or out of anything. Yes, that is true. But it can come out of hoards and into carry trades. That is what we study. The gold basis tells us about this dynamic.
Conventional techniques for analyzing supply and demand are inapplicable to gold and silver, because the monetary metals have such high inventories. In normal commodities, inventories divided by annual production (stocks to flows) can be measured in months. The world just does not keep much inventory in wheat or oil.
With gold and silver, stocks to flows is measured in decades. Every ounce of those massive stockpiles is potential supply. Everyone on the planet is potential demand. At the right price, and under the right conditions. Looking at incremental changes in mine output or electronic manufacturing is not helpful to predict the future prices of the metals. For an introduction and guide to our concepts and theory, click here.
Next, this is a graph of the gold price measured in silver, otherwise known as the gold to silver ratio. It moved back down this week.
The Ratio of the Gold Price to the Silver Price 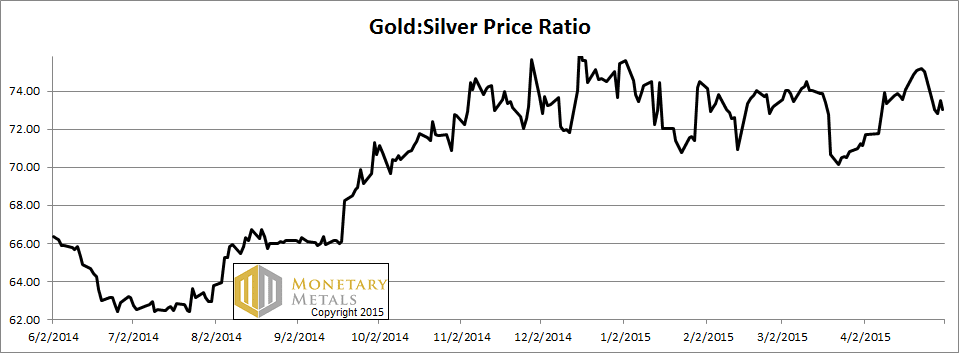
For each metal, we will look at a graph of the basis and cobasis overlaid with the price of the dollar in terms of the respective metal. It will make it easier to provide brief commentary. The dollar will be represented in green, the basis in blue and cobasis in red.
Here is the gold graph.
The Gold Basis and Cobasis and the Dollar Price
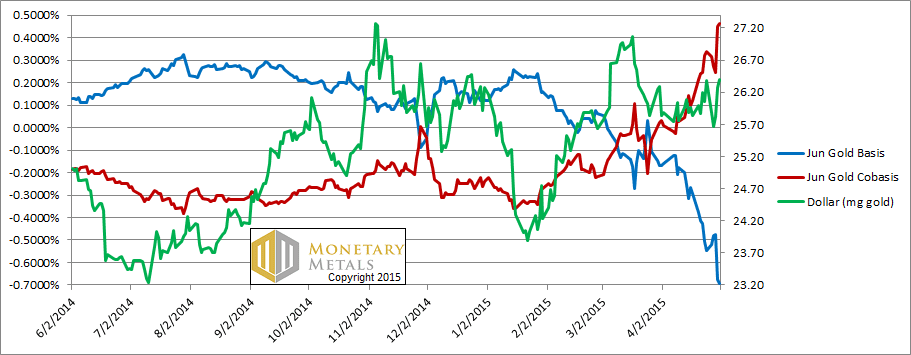
It is interesting to see that the scarcity of gold in the market (i.e. the cobasis, the red line) fell as the dollar dropped (i.e. the price of gold rose) on Mon-Tue, but not in proportion. And as the dollar rose once again, the scarcity of gold rose more.
Last week, the June cobasis was +0.34%. Now it is +0.46%. The August gold contract is within a few basis points of backwardation. Even December is above -0.25%. Both went up this week.
As of Friday, we calculate a fundamental price of gold that’s more than $100 over the market price.
Now let’s look at silver.
The Silver Basis and Cobasis and the Dollar Price
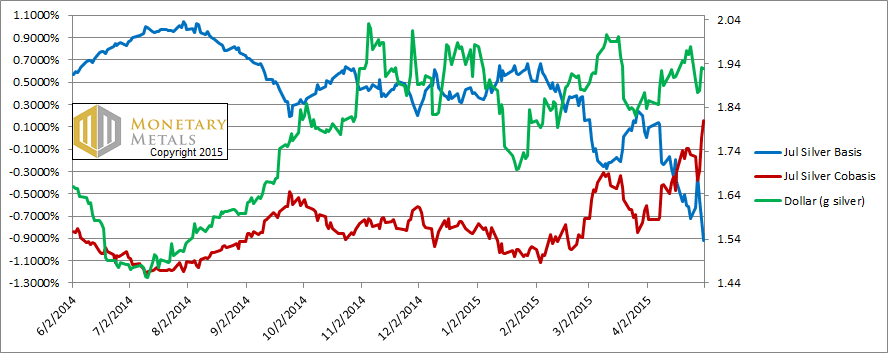
In silver, the cobasis rose this week, and the July contract now shows backwardation. One caution here is that the silver bases are much more volatile than in gold. Another is that silver has a much stronger basis distortion field than gold. Let’s look at that.
As a futures contract approaches First Notice Day, those who own it must sell unless they have the cash and desire to take delivery. They’re interested in leverage, to make dollar profits on a rising price, and only a small percentage actually want the metal. So they must sell the expiring contract and buy the next one. This pushes the expiring contract down, which tends to cause backwardation. This is a distortion, not real signal. It’s an artifact of the mechanics of the market. It is caused by having discrete contracts.
In silver, the near contract tends to be pushed down much more than the near one in gold. Also, there is often an effect on the next contract out and that contract is also pushed down in silver more than in gold.
In silver, we calculate a fundamental price about 70 cents below the market price.
© 2015 Monetary Metals

Keith,
Two observations and a conclusion:
First, the various gold charts (comments here have no reference to silver) that you show are essentially daily charts that typically follow the Comex contract roll from a nearby active front month to the next active delivery month. We have no contention with that. However, we would prefer to see your charts structured on a continuous basis (basis here not referring to cash vs. next futures differential) as we do with futures markets charts for our long-term technical perspectives. This may seem like an inconsequential quibble but there is a world of difference between using individual futures contract daily charts that switch on expiration to the next active futures contract’s historical data and a futures continuation chart that splices the next month data into a previous month’s expiration price. The former reflects the market’s inherent contango – a distortion – whereas the latter does not.
Second, looking at your latest charts (May 3, 2015) the $gold (mg gold) price is below its March 2015 high and that is below its November 2014 high while the June Comex basis and co-basis readings are way below/above their respective November 2014 levels. Obviously a major divergence has developed.
Our published work dating back to July 2013 made a case for a long-term gold price low in the $1155 – 1144 spot Comex area and in subsequent research (March 2014) we considered potential for a rogue low at $1112. The low-to-date by our methodology is $1130.40 on November 7, 2014 but the official Comex value for the same date is $1132.90. Comex gold action in November-December 2014 was climactic – suggesting that the 2011 – 2014 price downtrend was tapped out. As we interpret your latest report the June Comex gold market basis, co-basis and $gold price relationships are way out of line with a $market that is going to move below $1130.
In the long-term context that is based on your methodology there may be no compelling reason, other than your valuation model that considers the “fundamental” price of gold to be in the $1275 area vs. the Friday Globex last sale at $1177.40, to warrant strong commitment on the long-side of the market. In our long-term context, particularly given your basis/co-basis calculations, we are beating the drum for a major low and subsequent trend turn. We will eat those words if spot Comex trades below $1100.
Keith,
At what gold cobasis level (eg backwardation) would you think it would take for you to conclude, all else being equal, that the gold market has turned and a new leg up has likely begun? For instance, .75% or 1%?
Mark
Thank you for some very thoughtful comments.
Jim_n: Regarding the data series you request and trade recommendations, more soon… :)
miamonaco: It’s not just level, but how the bases move when the price moves. To call a durable price increase, I’d want to see the cobasis remain steady as price rises. Or even see the cobasis rise a bit. In the current market mode, every time price rallies, it’s like the air is let out of the cobasis balloon.