
Monetary Metals Supply and Demand Report: 31 May, 2015
Last week, we were skeptical of the alleged coming Chinese gold standard and its alleged impact on the gold price. This week, the price of gold fell $15. The price of silver fell 35 cents. We’re not aware of any Chinese silver standard rumors, but perhaps if one were to begin then the price of silver would take off like a rocket, or at least blip? ;)
At a cocktail party this week, a wealthy investor asked a seemingly simple question. “The world is a mess—so why isn’t the price of gold taking off?” If we distill the answer down to its simplest form, it’s this. So long as people buy gold in the hopes of a rising price, then its price will go up and down like all other assets. People want to be in whatever bubble is inflating. And this is the reality in 2015.
If you follow the saga of Chicago bonds, or Greek bonds or almost any debt anywhere, you see the same impending doom. Default is coming. When the perception is that, “there is still time,” traders are happy to own those bonds to earn the (much higher) yields. When default is imminent those bonds will go no bid. Who would own a piece of paper that will be dishonored imminently? What financial asset can one own that isn’t subject to default?
Central banks have bought up a lot of this bad paper. Many believe that central banks print, and there’s no such thing as bankruptcy. Actually, they borrow. The lenders are those who hold central bank paper, otherwise known as currency. The operation of a central bank may be convoluted. Its balance sheet may be opaque. But at the end of the day, if it issues liabilities to fund purchases of bad assets, then it will fail and its creditors—that’s we the people—will suffer.
This process is ahead of us. At first, it may seem pleasant for gold speculators. The price of gold will go up. Long suffering gold bugs will—at last!—be able to sell their gold at a profit! At least, they will get more dollars than they paid. However, what is the value of dishonored credit? This is not about the quantity of dollars. If it were, the gold price would be multiples of where it is now. It’s about the quality.
In the meantime, there are often tradable trends. Read on for the only accurate picture of supply and demand …
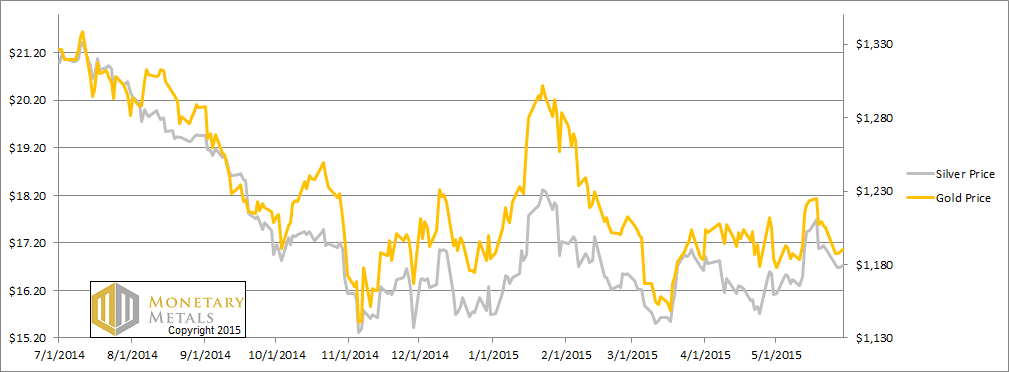
First, here is the graph of the metals’ prices.
The Prices of Gold and Silver
We are interested in the changing equilibrium created when some market participants are accumulating hoards and others are dishoarding. Of course, what makes it exciting is that speculators can (temporarily) exaggerate or fight against the trend. The speculators are often acting on rumors, technical analysis, or partial data about flows into or out of one corner of the market. That kind of information can’t tell them whether the globe, on net, is hoarding or dishoarding.
One could point out that gold does not, on net, go into or out of anything. Yes, that is true. But it can come out of hoards and into carry trades. That is what we study. The gold basis tells us about this dynamic.
Conventional techniques for analyzing supply and demand are inapplicable to gold and silver, because the monetary metals have such high inventories. In normal commodities, inventories divided by annual production (stocks to flows) can be measured in months. The world just does not keep much inventory in wheat or oil.
With gold and silver, stocks to flows is measured in decades. Every ounce of those massive stockpiles is potential supply. Everyone on the planet is potential demand. At the right price, and under the right conditions. Looking at incremental changes in mine output or electronic manufacturing is not helpful to predict the future prices of the metals. For an introduction and guide to our concepts and theory, click here.
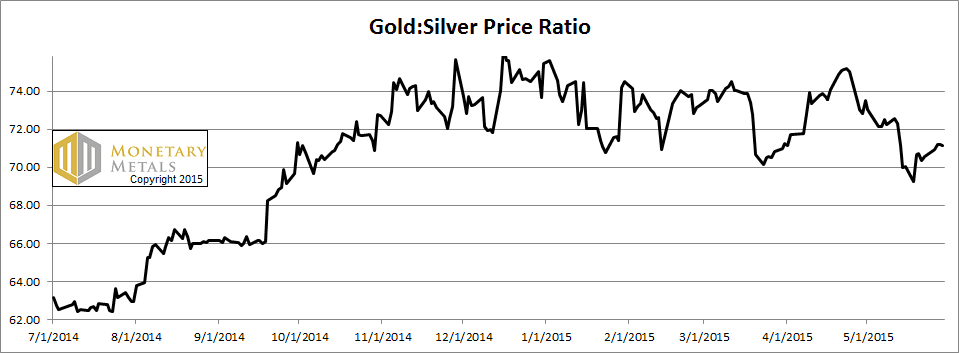
Next, this is a graph of the gold price measured in silver, otherwise known as the gold to silver ratio. It moved up a bit this week.
The Ratio of the Gold Price to the Silver Price
For each metal, we will look at a graph of the basis and cobasis overlaid with the price of the dollar in terms of the respective metal. It will make it easier to provide brief commentary. The dollar will be represented in green, the basis in blue and cobasis in red.
Here is the gold graph.
The Gold Basis and Cobasis and the Dollar Price
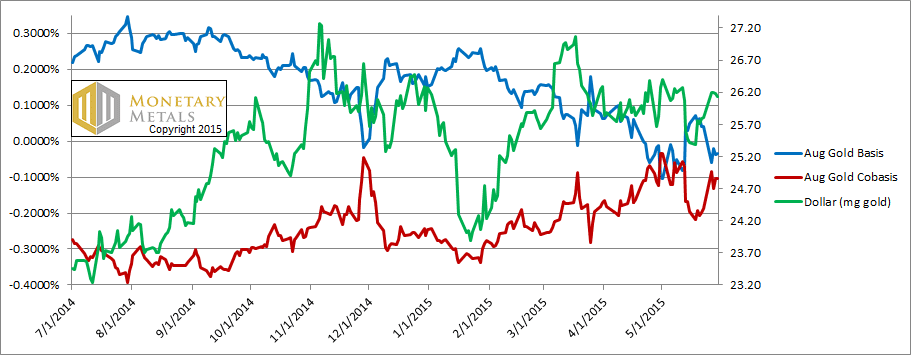
This was a shortened week, due to Memorial Day.
The price of the dollar, measured in gold, rose (i.e. the price of gold, measured in dollars fell). Abundance (i.e. the basis) fell and scarcity (i.e. the cobasis) rose. A little bit.
The fundamental price sagged a bit more, but is still $25 over the market price.
Now let’s look at silver.
The Silver Basis and Cobasis and the Dollar Price

As in gold, the dollar rose in silver terms too. As in gold, the cobasis indicator rose. The July cobasis is now in a small backwardation. This is partly due to the selling pressure on the July contract ahead of the roll in a few weeks.
The fundamental price of silver is still over a buck under the market.
We call ‘em like we see ‘em. There will come a time when we jump up to the rooftops to scream “skyrocketing prices ahead!” Today is not that day.
© 2015 Monetary Metals
“The world is a mess—so why isn’t the price of gold taking off?”
Your answer is spot on. Gold is many different things simultaneously. It can be a vehicle for short-term trading like any other commodity. It can be bought for long-term investment since it doesn’t spoil or decompose. It can be held as an historically proven instrument for carrying generational wealth into the future.
Or it can be bought and held as insurance against a systemic financial calamity or currency crisis or collapse. I think this is the view held by institutions that own gold. Gold can always be sold, or posted as collateral; it is the universal currency accepted by everybody even when nothing else is accepted.
One of the hallmarks of a financial crisis is the spiking of overnight repo rates. This is caused by cash going into hiding or hoarding or fleeing the system altogether. The overnight repo market is essentially a match-making operation pretty much run by JP Morgan. Banks with excess money to lend declare what they will accept as collateral for the loan (Tbills, Tbonds, commercial paper, gold, etc.) and banks that need to borrow post whatever they have that matches. In a financial crisis when interest rates are volatile and crazy and nobody knows what a proper rate should be or how to value any financial instrument, and nobody knows if their counter-party will go broke, everybody knows the price of gold as it is a 24 hour/day global market. So gold is what will be used. With an abnormal amount of gold coming on the market suddenly, what do you expect the price of it to do? Do insurance company stocks go up when a hurricane hits?
Incidentally, I think this may explain the JP Morgan gold market manipulation rumors (not that they don’t do shenanigans on their own in other aspects). Since they run the match-making operation they also are custodian for the assets held for collateral. Just like your stock broker has ITS NAME on your stock certificates that you bought with your money, JPM has its name on the assets the banks have with it. When a bank accepts gold as collateral for the loan it immediately sells it (actually tells JPM to sell it) because their unit of account is a currency, not gold. And of course, all the banks that accepted gold as collateral are telling JPM to sell their gold too. That’s why you get a huge dumping of 100 tons of gold at 3:01am.
After the financial hurricane passes and gold has performed its insurance function, gold stocks are rebuilt (and insurance company investments are replaced), and the price rises again.
The last large dump of gold that I know of was about the first week of December 2013 but wasn’t aware of any financial crisis. Then about a week later I read that overnight repo rates in Ukraine had spiked to over 20%. Money was fleeing the country so the shortage of cash was extreme. And then in January 2014 the war started and the value of their currency collapsed.
Can anybody point me to a more in depth discussion on the central banks borrowing versus printing?
Or do they print (physical paper currency or numbers in an electronic balance sheet) in order that they can borrow?