
The Gold and Silver Fundamentals, 30 Aug, 2015
Last week, we called for a rising gold to silver ratio. On Wednesday, this ratio hit nearly 80 before backing down a bit by the end of the week. It did not happen with a rising price of gold, rather it was a function of a falling silver price. On Wednesday, the silver price was down $1.22, or -8%. By the end of the week, it had rebounded along with the gold price.
We said we thought silver was overpriced at $15.31. Read on, for our take on $14.53. But first, let’s discuss the concept of the fundamental price.
We have been discussing fundamental prices of gold and silver, and contrasting them every week with the market price. This is how we have known that the price of silver would fall since the inception of this Report a few years ago (and prior to that). This is why we thought that the gold to silver ratio would likely hit 80 or more (as it did on August 26). It should be noted that most others were expecting silver to outperform gold.
The fundamental price is not a timing mechanism, but a valuation metric. It tells us which way supply and demand forces are applying pressure to the price. Sometimes, it is telling us the price is far from its fundamental levels. We recall the summer of 2013 when there was a ferocious rally in the price of silver from $19 to $25. That rally flew in the face of the fundamental valuation of the metal. We knew that the $25 level would not hold, despite the charts and the excited cheering from the silver bugs.
The price of silver has not been up to that level since.
This is a bad news, good news scenario. The bad is that the price can sometimes move counter to the fundamentals. Most people trade based on charts. They are looking for certain patterns to tell them when to buy or sell. Others—especially in gold and silver—trade based on rumors and often conspiracies. We recall more than a little such chatter in the summer of 2013.
The good news is that these episodes where price deviates from value provide trading opportunities. The farther the price gets away, and the longer it stays there, the more likely that there will be a sharp move opposite to what most market participants expect.
This is why you always keep some power dry (and one more reason never to naked short a monetary metal).
Here is a graph showing two weeks in July that had a significant market price move. We have overlaid the fundamental price.
Market vs. Fundamental Price Volatility
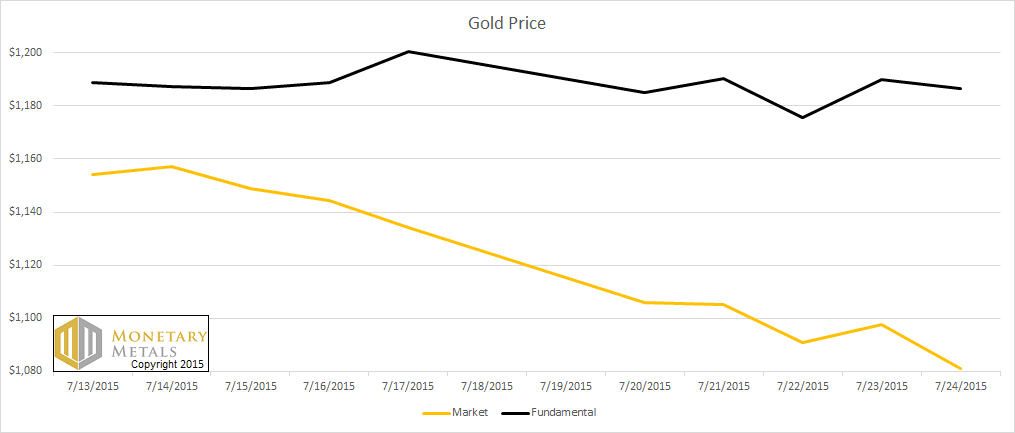
From Tuesday in the first week through Friday the next, the price dropped from $1,157 to $1,081, -$76 or -6.6%. The fundamental price stayed in a range of $1,176 to $1,200. Also, the fundamental did not trend. Those two extremes are outliers. Removing them, and the fundamental price changes over that period from $1,189 to $1,187.
The fundamental price is less volatile than the market price. This makes sense, as the market price can bounce around like a pinball when speculators flip from manic to depressive to manic again. The supply and demand fundamentals don’t usually shift so rapidly, except when something real changes (a Fed official jawboning in TV does not count as something real).
So what is it?
The fundamental price is the output of a Monetary Metals algorithm. Before he studied Austrian economics, Keith Weiner was a software developer and architect. He married the engineer’s data-driven approach to his economist’s understanding of the gold and silver markets. The result is a model that combines the best aspects of econometrics and an Austrian view of gold.
Econometrics applies math, statistical methods, and computer science to economic data. That describes the Monetary Metals fundamental price algorithm perfectly. However, the article goes on to describe the quest for correlation, describing this as the “concurrent development of theory and observation.”
We depart from conventional econometrics there. There’s a well-known logical fallacy—at least outside econometrics—known as correlation does not imply causation. We don’t look to the data to develop our theories.
As regular readers know, we have our theory. A rising basis indicates rising abundance, and a rising cobasis indicates rising scarcity. This theory comes from looking at a futures market as a warehousing market (discussed here). If the price of a futures contract is bid up, then the basis increases. This is a signal to the warehouseman to carry more of the commodity—buy spot, sell future. The market only sends this signal when the good is abundant.
Scarce goods, by contrast, are pulled out of carry. In scarcity conditions, the price of the good in the spot market is rising. This signals the warehouseman to sell spot and buy a future. He ends up with the same position, plus a free profit. The reason why such a risk-free profit is offered by the market is that few people have the good, thus scarcity.
It is very Austrian, going back to the founder of the school Carl Menger, to focus on spreads rather than prices. Most analysts and traders look at price charts. We look at (and publish) spread charts, the basis and cobasis.
Another very Austrian idea is to look at change at the margin. In our case, we are very interested in how the basis and cobasis move as price moves. Every week, we print graphs showing the price of the dollar in ounces of gold (which is the inverse of the gold price) and the bases. How the price moves in relation to moves in the basis and cobasis tells us whether there is a fundamental change in the value of gold or whether it is just speculators repositioning.
A key part of this theory is that speculators or hoarders are the marginal buyers or sellers of spot gold and futures gold, respectively. Other key players, such as miners (net sellers), manufacturers (hedging their inventory) and industrial users (net buyers), do not generally make big changes to their positions–operational and profit consistency are their prime motivations.
Hoarders in general, are people who buy metal intending to keep it for the long term, or at least a while. Their trading is tempered by the fact that buying physical gold, unlike futures, can involve significant delivery and storage costs.
Speculators, on the other hand, buy only to sell. They may sell to take profits if the price moves their way. They may sell to cut losses if the price moves the other way. So their effect on price is ephemeral, to be reversed with the next change in sentiment.
So we measure the difference between the behavior of these two groups: speculators and hoarders. Our calculated fundamental price backs out the price impact of the speculator, to show us a naked picture of the balance of supply and demand.
Unlike those who trade on rumors, we are using objective data available by observing the market. Unlike chartists, we are using spreads rather than raw prices. Unlike analysts who look at Indian or Chinese imports, we are looking at data that captures the whole market, not just the move from one corner of the market to another.
The model is the culmination of 6 years of Weiner’s study of economics and gold, and built with the knowledge developed in two decades of his previous career as a coder, and then building a software company (DiamondWare, which he sold to Nortel Networks in 2008). In his software days, he was heavily involved in signal processing and the separation of information and noise in communications. That is what Monetary Metals’ Fundamental Price is all about–pulling out the speculative noise from the price signal to reveal information about the fundamentals of supply and demand.
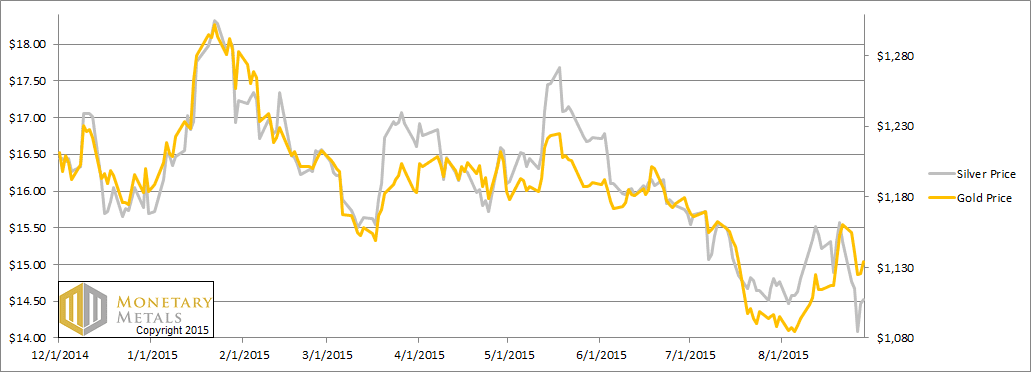
Now here is the graph of the metals’ prices.
The Prices of Gold and Silver
We are interested in the changing equilibrium created when some market participants are accumulating hoards and others are dishoarding. Of course, what makes it exciting is that speculators can (temporarily) exaggerate or fight against the trend. The speculators are often acting on rumors, technical analysis, or partial data about flows into or out of one corner of the market. That kind of information can’t tell them whether the globe, on net, is hoarding or dishoarding.
One could point out that gold does not, on net, go into or out of anything. Yes, that is true. But it can come out of hoards and into carry trades. That is what we study. The gold basis tells us about this dynamic.
Conventional techniques for analyzing supply and demand are inapplicable to gold and silver, because the monetary metals have such high inventories. In normal commodities, inventories divided by annual production (stocks to flows) can be measured in months. The world just does not keep much inventory in wheat or oil.
With gold and silver, stocks to flows is measured in decades. Every ounce of those massive stockpiles is potential supply. Everyone on the planet is potential demand. At the right price, and under the right conditions. Looking at incremental changes in mine output or electronic manufacturing is not helpful to predict the future prices of the metals. For an introduction and guide to our concepts and theory, click here.
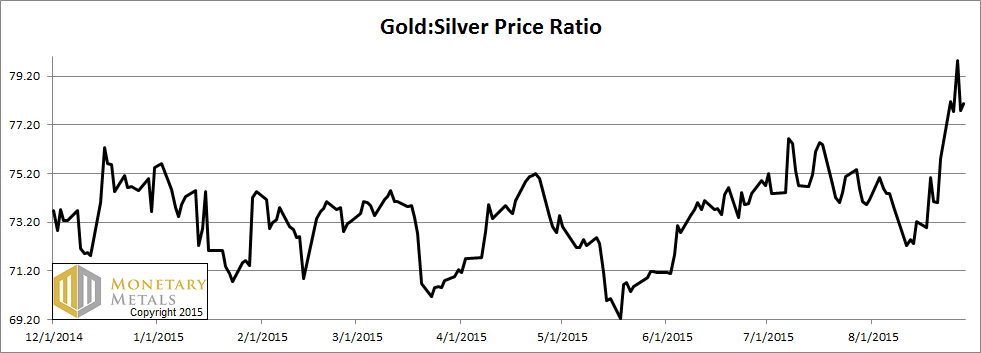
Next, this is a graph of the gold price measured in silver, otherwise known as the gold to silver ratio. The ratio moved up sharply again this week.
The Ratio of the Gold Price to the Silver Price
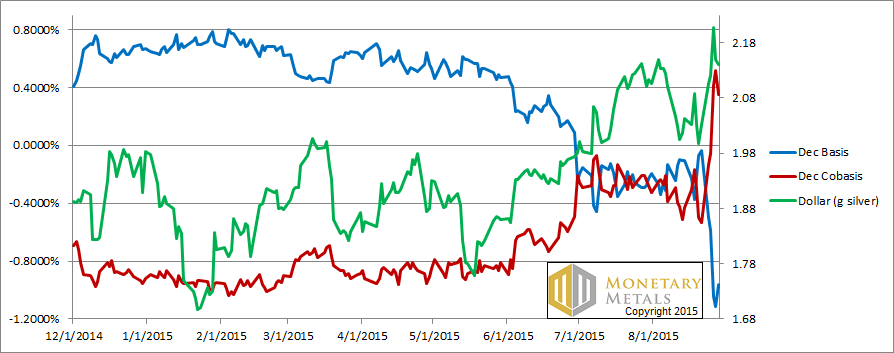
For each metal, we will look at a graph of the basis and cobasis overlaid with the price of the dollar in terms of the respective metal. It will make it easier to provide brief commentary. The dollar will be represented in green, the basis in blue and cobasis in red.
Here is the gold graph.
The Gold Basis and Cobasis and the Dollar Price
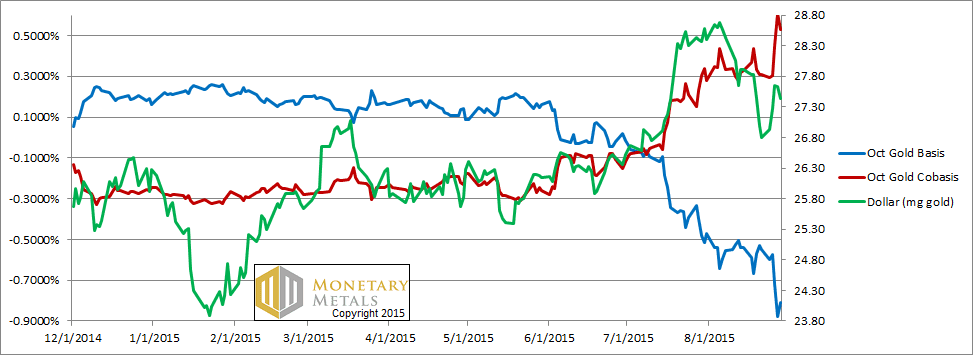
The price of the dollar rose, from 26.8mg gold to 27.4(i.e. the price of gold fell). The cobasis went up along with it.
The fundamental price is up a few bucks from last week.
One could certainly do worse than to pick up gold with this kind of discount on offer, should one perhaps be in the market for the metal.
Now let’s look at silver.
The Silver Basis and Cobasis and the Dollar Price
The price of the dollar rose from 2.03g to 2.14g silver (i.e. the price of silver, as measured in dollars, fell). As you can see, we now have backwardation in the December silver contract. Yes, it’s above that of the December gold cobasis (though beyond that month, the silver term structure is different from gold—not so bullish).
The silver fundamental price is now above the market. They key question is: will this state hold?
Monetary Metals will be in New York City on Friday afternoon, September 11. You are cordially invited to join us for a discussion of economics and markets, with a focus on how to approach saving, investing, and speculating. Midtown. RSVP here.
© 2015 Monetary Metals
I think I’m relatively clear about the above. I would call it a ‘system’. A way of predicting the future which is unpredictable. This is not to say it doesn’t work. Over my pretty long life I have noticed that systems really work well until they don’t.
One thing I must have missed is the wilful manipulation of the futures price, Throwing millions of IOUs into the market at quiet times to crash the “price”. How does that fit in?
As ever an excellent article Keith. So pleased to learn that the fundamental price is not just sucked haphazardly out of your thumb. Trusting that your algorithm is mathematically sound.
Thank you so much, Keith!!! You are the lone lighthouse of truth in a raging sea of confusion called precious metals investing. You are a true friend of small investors. :)
Thank you, thank you, thank you. And God bless you.
Keith,
I’d echo and expand a bit on Baron’s thought above. It seems to me that your theory relies on honest reporting of what actually is in the warehouse. So my biggest red flag in this area occurred when the Comex added a disclaimer to reported inventory totals saying the figures were for reference only. The major bullion banks self report, there is no independent audit of their figures and they have been caught and fined for corrupt activities in a variety of different areas (Libor, FX, mortgages, …). They are still in business only because they are too big to fail and the government (and Fed) props them up.
Does your model have a corruption factor component that you have not mentioned or do you just assume the reported figures are accurate? If you assume the figures are accurate and at a late date fraud in this area is exposed might not we expect an abrupt adjustment in the basis, co-basis, GSR and prices?
Assuming the word of felonious liars to tell the truth in this area after being caught in so many other nefarious activities would not appear to be prudent to me.
Keith, for the past several months you have been one of my must-read bloggers. Thanks for the insight into your thinking and methodology. I forwarded the link to this entry to my son in college, who is an econ/math major, as an example of the kind of analysis to which he should aspire.
For those commenters who think there is nefarious manipulation/dumping going on, I point them to my comment on this blog for your 5/31/15 entry.
And me to amusedobserver’s list of must-read blogger fans. Following your observatoins I did go ahead and acquire more “shinies” to my stack. I have been interested in getting more junk silver but whilst I was looking I noticed a rather brutal premium on $100 face value bags. While coinflation said that the melt value was roughly ten to one, ( a Mercury dime being worth around $1 USD FRN), the $100 bag was selling for around $1450, a premium of something like 45%! Bullion did not carry anywhere near this amount of premium. Any ideas as to why this may be? The one explanation I heard was from the paranoid crowd who thought it was that holding US coins made you less susceptible to confiscation in the event TPTB ever came a-knockin’. My thoughts were that if them feds did come, if it was silver, they’d take it anyway. I’m curious if you have any thoughts on this.
Best regards,
Theo
Thanks for the comments and kind words.
Baron: This system will stop working the day that speculators stop (A) guessing wrong and/or (B) stop betting on the prices of the metals using leverage. I am able to sleep soundly for the time being. ;)
blowforhome: Not my thumb… it depends on what side of the bed I get out of. :)
Perspective001: We don’t use the reported warehouse numbers, because they’re not terrible useful. Banks can have gold in all sorts of places that are not registered depositories for the futures exchange. They may also have a variety of gold receivables (e.g. leases) that mature on or before the futures contract. Whenever I say “warehouse” I am referring to analyzing the basis to determine it.
Theosebes: I had heard that the premium on junk silver had spiked. I don’t know the specific reasons, but it wouldn’t surprise me if it was a wave of confiscation fears from a rumor or story. Maybe not.
“””The 16.6 million gold ounces transferred daily in July was down from 17.9 million in the same month of 2014, according to the report. The 155.2 million silver ounces transferred daily was a big jump from 121.7 million in the year-ago period.
By Allen Sykora of Kitco News; asykora@kitco.com“””
that’s DAILY. do the dollars reach the trillions annually?
why doesn’t that show up on a public financial statement somewhere as inventory and / or trading gains and losses? i think i know the answer to that: the results would be absurd. all private? lumped in with oil and pork bellies? ;)
I guess that CME and COT reports on money come into existence in a weird world where books are kept in something other than money. here i think perspective has a point, we have fiduciary and custodial issues. they’re protected, but not policed, by cops.
thanks to keith for making something out of the only info we have. we can tell the money from the pork bellies by the backwardation. as i understand it. happy coining all.
Keith,
Thanks for the weekly report.
Considering annual Gold production is pretty much a known and stable and most of the Gold ever mined still exists why is there so much futures speculation in Gold. Some say 100+ times the physical market.
Gold is not like most commodities which are effected by weather, production and many other influences, fiat currencies have many reasons for price variation, Government policy, QE, currency wars, trade wars etc.
Even though we are told Gold is not important obviously someone seems to think Gold is very important hence the inherent large futures market. It seems as though Gold is quietly still the universal measuring stick for most things.
Thanks
Keith, I have an existential question about NASOE’s theory on gold backwardation.
The argument goes like this:
(1) If the entire gold stock were brought to market (at a sufficient price) backwardation should be impossible, as it is not a “scarce” good (relative to the flow of mining);
(2) Temporary backwardations indicate a scarcity of “phyz” coming to market (either because the dollar price is too low, or the counter-party risks of recovering one’s gold seem too high).
(3) Permanent backwardation will eventually cut the dollar off from most other commodity markets, and is the signal flare of the collapse of the irredeemable-dollar economy.
So far, not bad (genius, actually)…
Now you come along and start to articulate that backwardation invites and rewards the “decarry gold” arbitrage. Indeed, your charts are showing a better return (in gold) for decarrying one’s gold than is available from most savings institutions, albeit at unknown risk. Return-chasing, being what it is, the situation is comparable in some sense to the existence of a gold bond. The difference being in less choice of counter-party (many businesses might issue gold bonds, but a gold futures contract is offered by just a few bullion banks, whose books are less than transparent).
So now my question:
Is temporary backwardation the sign of a burgeoning gold leasing market, and the hope of gold bonds coming forth (presumably a Good sign that gold is starting to circulate and is being relied upon to store value by more people), or is it a Bad omen of dollar collapse?
Isn’t it the case that if irredeemable dollars didn’t exist, you could not define “Backwardation” at all? As one who keeps his books in gold units, do you perceive the situation to be that the dollar is in Contango? If so, could that correspond to the dollar merely languishing as gold did while in contango relative to the dollar, rather than actually collapsing altogether?
If the dollar is in contango, the trade is rewarding warehousemen for carrying dollars.
That describes the NIRP world in a nutshell. The question being why the world needs warehouses full of dollars. That is where the question turns existential, as we each receive our statements from these warehouses every month.
So good to meet up with you in Wyoming,
-g-
I’m little bit confused about gold price downing.