
Possible Silver U-Turn Report, 7 Feb
Wow, did the dollar move down this week! It dropped more than it has in quite a while. It fell 1.3mg gold, or 0.1g silver.
Gold and silver bugs of course are excited, as they look at it as the prices of the metals going up $55 and 72 cents respectively. The collapse of what most think of as money—including especially said gold and silver bugs—is great fun and profitable. At least if you’re short the dollar.
By the way, when we say the dollar fell we do not mean in terms of its derivatives such as euro, pound, yuan, and so on. We’re well aware that the dollar index fell from 99.6 to 97. The euro and other currencies are no more suitable for measuring the dollar, than, well the dollar is to measuring gold. And for the same reason. You can’t measure the something by reference to things derived from it.
Last week, we said:
“It’s far too early to call a bottom in the silver price. However, the movement on Thu and Fri is the sort of action we should expect to see more of if silver is to return to a bull market. It will take more action like this before we change our position on the white metal, but it is worth reporting on what we see when we see it.”
Read on for an update on the gold and perhaps more interestingly the silver supply and demand fundamentals…
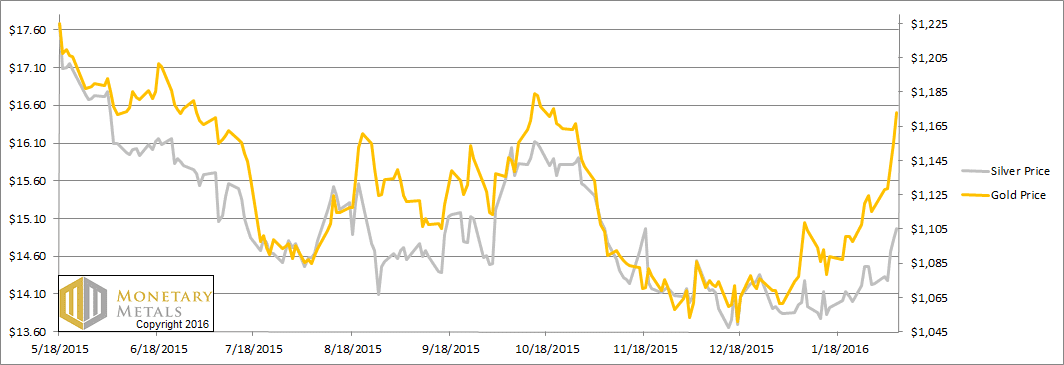
But first, here’s the graph of the metals’ prices.
The Prices of Gold and Silver
We are interested in the changing equilibrium created when some market participants are accumulating hoards and others are dishoarding. Of course, what makes it exciting is that speculators can (temporarily) exaggerate or fight against the trend. The speculators are often acting on rumors, technical analysis, or partial data about flows into or out of one corner of the market. That kind of information can’t tell them whether the globe, on net, is hoarding or dishoarding.
One could point out that gold does not, on net, go into or out of anything. Yes, that is true. But it can come out of hoards and into carry trades. That is what we study. The gold basis tells us about this dynamic.
Conventional techniques for analyzing supply and demand are inapplicable to gold and silver, because the monetary metals have such high inventories. In normal commodities, inventories divided by annual production (stocks to flows) can be measured in months. The world just does not keep much inventory in wheat or oil.
With gold and silver, stocks to flows is measured in decades. Every ounce of those massive stockpiles is potential supply. Everyone on the planet is potential demand. At the right price, and under the right conditions. Looking at incremental changes in mine output or electronic manufacturing is not helpful to predict the future prices of the metals. For an introduction and guide to our concepts and theory, click here.
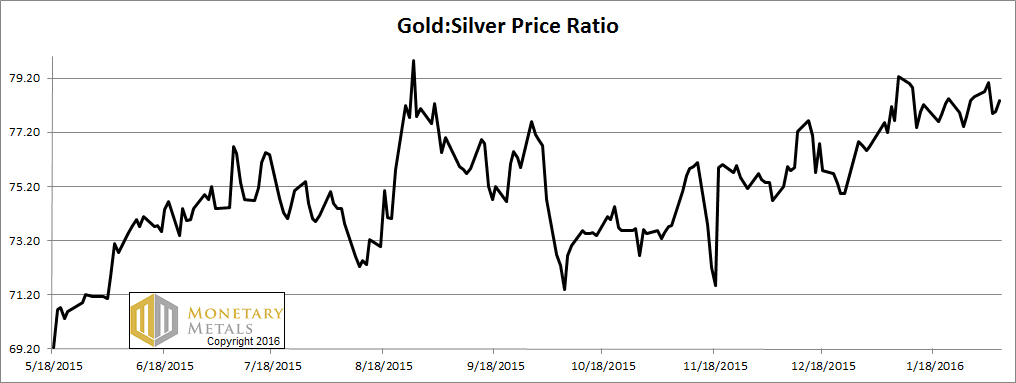
Next, this is a graph of the gold price measured in silver, otherwise known as the gold to silver ratio. The ratio was volatile this week, first up and then down, but it ended down but a smidge.
The Ratio of the Gold Price to the Silver Price
For each metal, we will look at a graph of the basis and cobasis overlaid with the price of the dollar in terms of the respective metal. It will make it easier to provide brief commentary. The dollar will be represented in green, the basis in blue and cobasis in red.
Here is the gold graph.
The Gold Basis and Cobasis and the Dollar Price
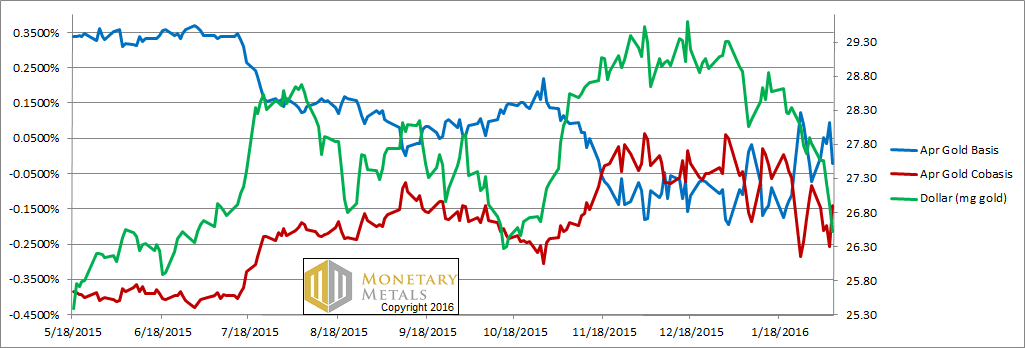
The red cobasis line (i.e. scarcity) is overall tracking the price of the dollar in gold (i.e. the inverse of the gold price). In other words, as the price of gold rises, the metal becomes less scarce. However, notice that move up on Friday. The cobasis did not close much below last Friday’s level, despite the price of gold moving up sharply.
The fundamental price of gold moved up this week, though not as much as the market price. The fundamental remains a hundred bucks above market. Gold is still offered on discount.
Now let’s look at silver.
The Silver Basis and Cobasis and the Dollar Price
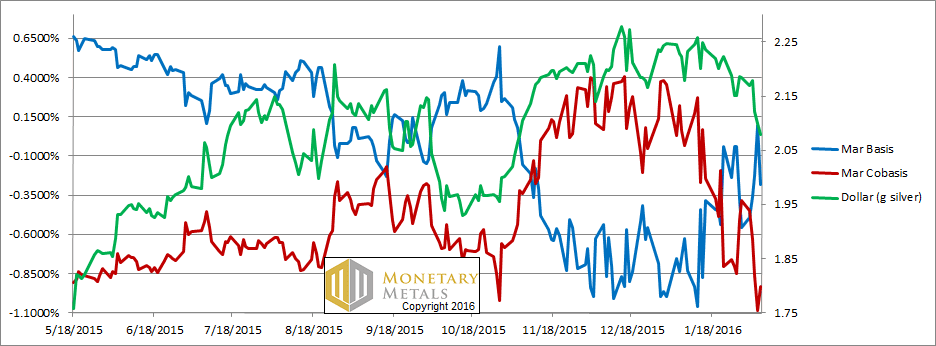
Whoa. Unfortunately for silver speculators, the cobasis fell dramatically. Silver is simply more abundant to the market at this higher price.
To our comment last week, one can either take hope or despair. The hopeful part is that the fundamental price did move up about 30 cents. That makes two weeks in a row for strengthening fundamentals.
The not-so-hopeful bit is that the fundamentals did not move nearly so much as the market. Less than half as much, in fact.
This action could be consistent with a durable turn in the market. It could also be consistent with the same old pattern we’ve had for a long time: volatility in the basis along with volatility in the price.
What gives us pause (aside from the magnitude of the drop in silver price, both in terms of calendar time as well as dollars) is that there seems to be such pervasive expectations in the precious metals community. If the horse is to remain firmly in front of the cart, it is the hoarders that have to come in with sizeable and lasting demand first. Then, and only then, will the speculators have their long-awaited opportunity to front-them amidst a market price than only wants to go up.
What gives us reason for hope of rising prices is that surely defaults are coming. Crude oil may be up from $26 to $31, but we doubt that is going to save many commodity producers. Meanwhile, the price of transporting bulk dry goods has collapsed to a fresh new low that’s about half of the post-2009 low (and a small fraction of the level before the crisis hit in 2008). How are shipping companies going to service their debts? And what about the other commodity producers who used to hire these ships to send their goods? What about smelters, refiners, sheet manufacturers, and for that matter automakers and construction firms? More layoffs are coming, which will mean repossessed cars, foreclosed homes, evicted tenants, and all of the other wreckage familiar from 2008.
The rising dollar itself is a threat to many borrowers worldwide, as they have income in their national currencies which are falling (notwithstanding the action this week) against the dollar. In other words, their monthly payments are going up.
Gold, and to a lesser extent silver, are the only financial assets that provide a haven in a debt default storm.
We shall see. The markets are offering more excitement than they have in quite a while. Look tomorrow for our analysis of the silver fix fiasco that occurred last week.
© 2016 Monetary Metals
“Defaults are surely coming.”
This is becoming a sort of conventional wisdom. It would certainly be true for the smallest, most recent and most leveraged oil drillers or those unable to bring their costs down. But industry analysts are sending a different message:
“According to the consultancy Wood MacKenzie, the cash cost of US¹s shale oil is at US$15 per barrel and even at a price of US$30 per barrel, only 6% of production worldwide fails to cover its average variable costs and faces shutdown. Moreover, the US shale oil industry has been becoming more productive, with a well in the Bakken region originally producing 200 barrels a day in 2011 now producing close to 700 barrels a day, reckons ANZ commodity strategist Victor Thianpiriya.”
Granted, so of those economies have come at the cost of shutdowns, whose secondary effects are to bring down region economies and bankrupt the drilling and shipping support structure there. I’m just not yet seeing this as sufficiently broad a problem to be the cause of major collapse. Look to EMs, and the secondary effects of international trade shutting down for that kind of destabilizing influence.
Thanks Keith. Yes, the Baltic dry Index is somethng out of a horror movie that never ends. I look forward to you insights tomorrow as I am on the line as to whether to accrue because the bottom has set or hold my powder dry.
I sincerely think the bloodbath in the equities market has not truly begun. I think we need to see major corrections that will see the broader markets lose up to half of their value. When those days come, I think that PMs will share their fate. I’m just a little concerned about central banks becoming interventionistic, (like we haven’t seen enough of that already).
Best,
Theo
Thank you for the update Keith.
The Italian banks also look like something out of a horror movie, down about 30% in 1 month.
Could this all not spiral out of control very quickly ?
Thanks for your comments.
Greg: what about the fixed costs, most especially including debt service? If variable costs are low, then that supports the case for cheap oil to stay with us. Bankruptcy will not stop the oil flowing…
Agreed re: EMs including especially China.
Btw, Swiss 15-year yield < 0 again. Theosebes: It is possible that gold owners will sell to speculate on a further rise in the dollar. jmf: it sure could.
What happened? It looks like you posted very different data for the same dates (Nov 7) in two different reports.
In your Nov 8 report you showed extremely low numbers as of Nov 7th for the basis:
-0.8% for Gold (-2.6% for Silver) for Nov 7. In your Feb 7 report you showed much smaller numbers as of Nov 7th for the basis: -0.05% for Gold (-0.05% for silver).
Which of these is correct? Did something get restated?
Milo
In November, we would have been looking at the Dec contracts for both metals. Today, we’re looking at March silver and April gold.
Thanks. Since the basis (and co-basis) depends on the contract, would it be appropriate to identify the contract being used for each metal as part of the graph?
In your “Introduction” (9/8/2013), you define basis (and co-basis) as a difference in dollar prices. You also say “Basis and co-basis are the annualized returns for carry and decarry. Quoting them as annualized returns helps put them in perspective.” Q. Exactly how are those future-spot dollar-price differences converted into annualized returns?
“Since the basis (and co-basis) depends on the contract, would it be appropriate to identify the contract being used for each metal as part of the graph?”
General version of specific answer, Gold and Silver contracts are structured differently. They operate on what are called close enough to be appropriate time and amount principles (interesting topic) but different nonetheless. If you trust Keith’s word, I think the graphs are reliable. They are more a quarterly unveiling than a prediction
What I would like to see is a dollar portrait: beginning of quarter (one for gold one for silver) Tonnage of metal on hand. Tonnage of metal to be sold. . Tonnage promised to be delivered.
Aggregated. Break it down by warehouse or wherever they connect bars to the spot price.. Then we could all do math.