
And Silver Crashes Some More! 24 Sept

A few days ago, we wrote about a big silver crash. The price dropped around 7.5%.
And the basis dropped from around 2% to 0.6%. At the end, we said:
“The key question is: what is the follow-through? If the price stays down and the basis goes back up, that will be a bearish signal. If the basis stays down, that means the silver market is markedly tighter at $24.50 than it was at $26.75.”
Which this brings us to yesterday’s silver dive. Here’s the graph of the day’s action.
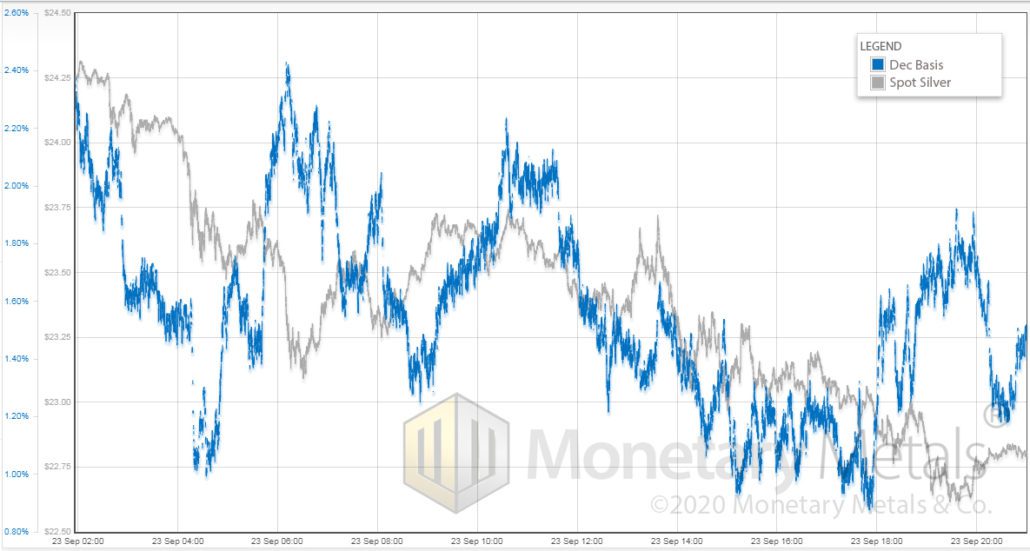
At the start of our graph, 2am (London time) the price is just a bit lower than at the end of the first crash day. $24.25. But we see the basis is up to 2.3%. That’s higher than it was at the beginning of the first crash day, when the price was $26.75.
Clearly, there was some buying of futures in the meantime. Perhaps speculators were betting on a quick spike in price.
Over the course of the day, the price drops to around $22.80. This is a drop of 6%. And the basis ends at around 1.5%.
So, yes, there is a drop in basis. From a higher level than on the first crash day when the price was much higher. To a higher level than at the end of that day. And not that big a drop.
The selling was driven by futures, yet… yet… there was plenty of selling of metal too.
We are now $4 down in price, and the basis is not down very much. That means the abundance of silver to the market at $22.80 is not much less than it was at $26.75.
A price floor is expected when further selling the price down causes scarcity (and a price ceiling when further bidding the price up brings more and more metal to the market, i.e. abundance). Which hasn’t happened yet. But we have some additional thoughts to share, so stay tuned.


Leave a Reply
Want to join the discussion?Feel free to contribute!