
Don’t Short This Dog, Report 20 Feb, 2017
This week, the prices of the metals mostly moved sideways. There was a rise on Thursday but it corrected back to basically unchanged on Friday.
This will again be a brief Report, as yesterday was a holiday in the US.
Below, we will show the only true picture of the gold and silver supply and demand fundamentals. But first, the price and ratio charts.
The Prices of Gold and Silver
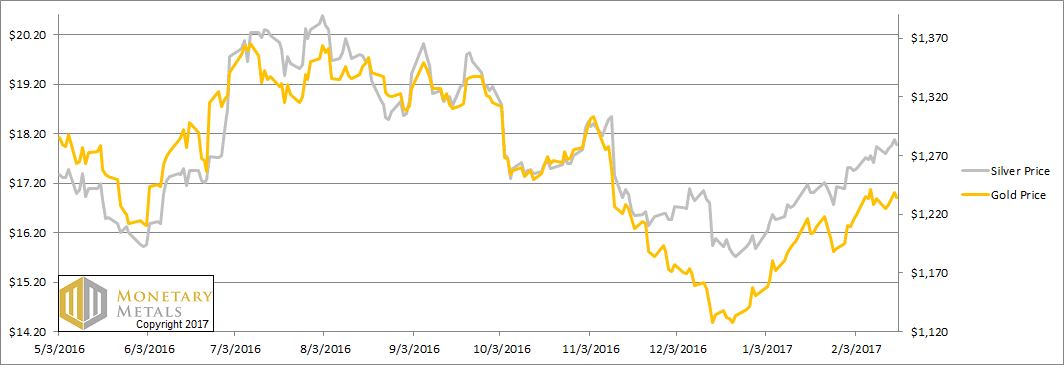
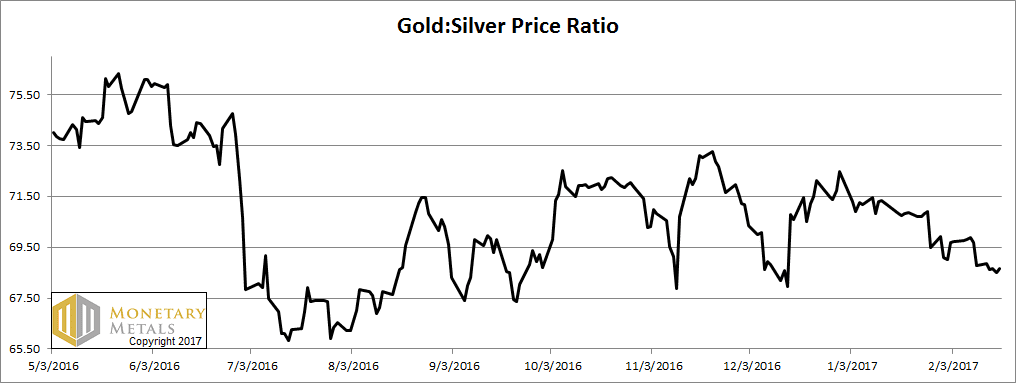
Next, this is a graph of the gold price measured in silver, otherwise known as the gold to silver ratio. It moved sideways this week.
The Ratio of the Gold Price to the Silver Price
For each metal, we will look at a graph of the basis and cobasis overlaid with the price of the dollar in terms of the respective metal. It will make it easier to provide brief commentary. The dollar will be represented in green, the basis in blue and cobasis in red.
Here is the gold graph.
The Gold Basis and Cobasis and the Dollar Price
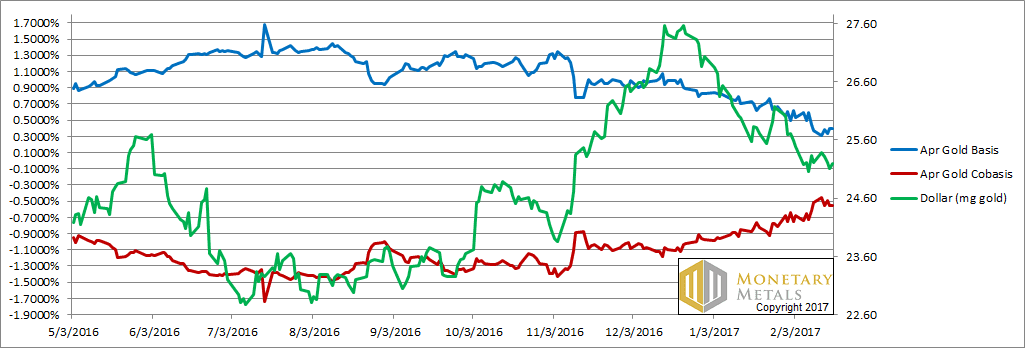
The price was unchanged, but the basis is up slightly and cobasis is down (i.e. gold became slightly more abundant). This is not the news dollar shorters (i.e. those betting on the gold price) want to see.
Our calculated fundamental price is all but unchanged around $1,360.
Now let’s look at silver.
The Silver Basis and Cobasis and the Dollar Price
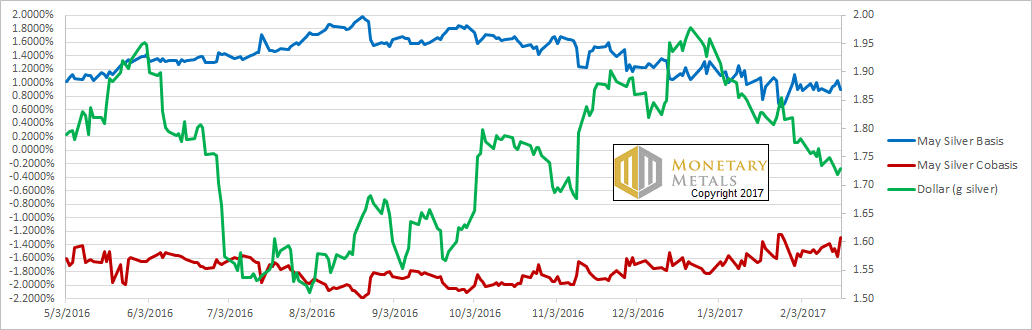
In silver, the basis is basically unchanged but the cobasis went up a bit. The silver market got just a bit tighter, and our calculated fundamental price is up more than 30 cents to about a quarter above the market price. Not exactly “bet the farm with leverage territory”, but definitely not “short this dog” either.
Watch this space. We have some exciting data science to reveal soon.
© 2016 Monetary Metals
Leave a Reply
Want to join the discussion?Feel free to contribute!