A quick glance at the data for ounces held by each Exchange Traded Fund (ETF) shows that right after the crash of 2008, ounces began to pour into GLD. Ignoring a little jitter, there was no significant outflow until 2013. GLD has lost over 20% of its metal so far this year, dropping from about 44M ounces to under 33M.
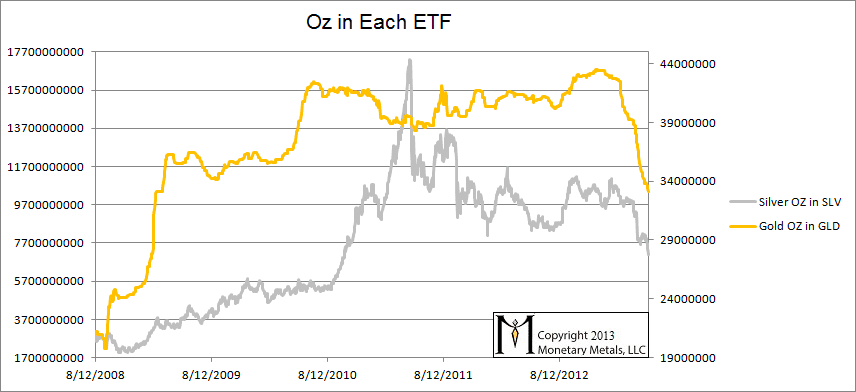
(silver ounces on left axis and gold ounces on right)
Silver is a more volatile market and the graph shows that inflows were slower to ramp up, peaked later with a sharp spike, and have been in a process of flowing out since that spike in early 2011. Today, SLV has about 2.5X the metal it did before the 2008 crisis, vs. GLD at 1.5X.
This chart of the ratio of metal held in the ETFs shows a clear picture of this behavior. Until about a year ago silver holdings were declining faster than gold holdings, though that trend has ceased.
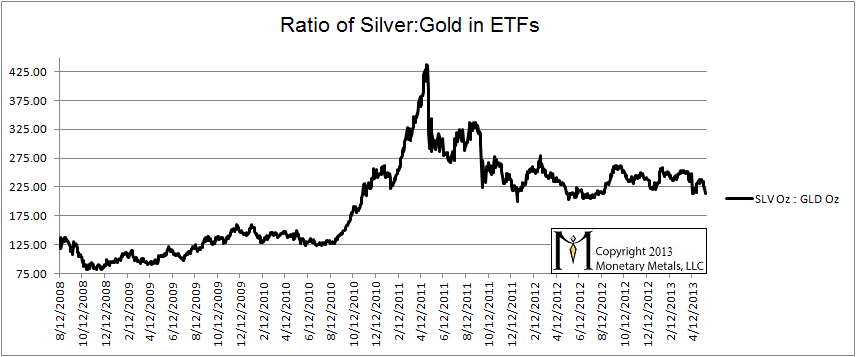
It is tempting to think of the ounces held by the ETFs as being correlated with the prices of the metals. Some price moves are clear in both the ETF holdings chart and the chart of the ratio of the ETFs. The salient feature of both charts is the run up in the silver price starting in the summer of 2010 followed by the spectacular crash in April 2011. The run up in the silver price from $28 in late August through $35 in September of last year is also visible.
We should be asking why. In regular stocks, prices can go up and down by ordinary buying and selling. The metal ETFs are unlike regular equities in that metal holdings can be added or removed at any time. But, why would price have to be connected to ounces of metal held?
The price of a metal ETFs can also go up and down by ordinary buying and selling. Therefore, we need a way to analyze the flows of metal without reference to price. As we see from the graphs, the linkage between metal held and price is indirect and loosely coupled, at best.
For a point of reference, let’s consider the open interest in the futures market. There is an important similarity between the futures market and the metal ETFs. It is also a market for warehousing metal, though with a different process.
When most people buy a gold future, they do so to bet on a rising price. They may assume that the other side of the trade, the party who sold the future short, is betting on a falling price. While there are of course bearish speculators, most short sellers in the futures markets are warehousing the commodity. They perform an arbitrage: simultaneously buy the physical good in the spot market and sell a future against it.
One might expect that inventory levels in the ETFs should be highly correlated with open interest in the futures markets. They are two different ways of warehousing metal. As we see in the chart below, there are some similarities but the chart is quite different.
Here is the chart of open interest in gold and silver futures.
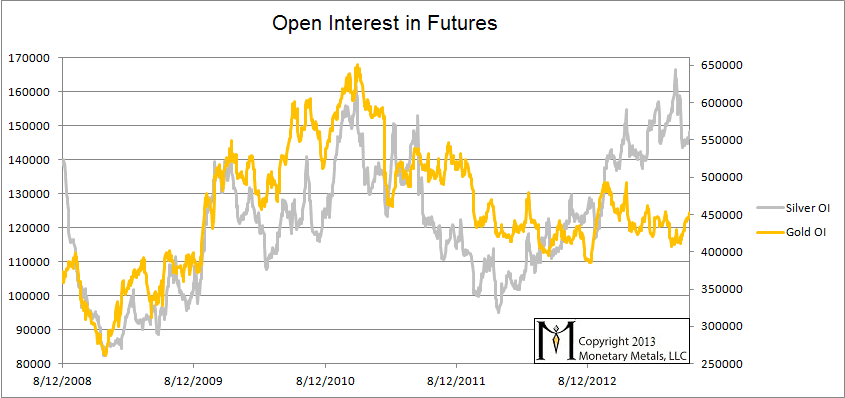
(silver contracts on left axis and gold contracts on right)
There are some obvious similarities with the graph of the ETFs. Futures also peak for both metals in 2010, though a few months later. One major difference is that gold open interest has been declining since 2010 whereas GLD holdings only began to decrease in 2013. Another is that silver warehousing in the futures market has been rising until very recently, whereas silver held by SLV has been falling since 2011.
Here is a graph of the ratio of silver to gold held for future delivery.

Obviously, this is a very different picture compared to the ratio of metal held in the ETFs.
If metal holdings had a simple connection to price or, to change in price, then both the ETFs and the futures should have the same trends. The fact that they do not means we must look to another explanation of why metal sometimes flows in and sometimes flows out.
The answer is arbitrage.
To extend the analogy of flows further, consider what makes water flow in nature? Water flows from higher elevation to lower. Arbitrage makes metal flow from a place in the market with a lower price to somewhere with a higher price.
As discussed above (and frequently in my writings, as the futures market is key to understanding gold today), someone will sell a new future when he can buy a metal at sufficient discount to make it worth his while. The arbitrage is buy gold bars / sell gold futures. To put it in perspective, if the ask on spot gold is $1360 and the bid on the December 2014 contract is 1370, he can make $10 or about 0.75% gross or 0.5% annualized. This is called carrying the gold. $10 is the carry and 0.49% is the basis (quoted as an annualized yield). Contracts can sometimes be closed by the opposite arbitrage: sell a bar and buy a future. This is only profitable when the cobasis is positive, which is called backwardation. Cobasis = Spot(bid) – Future(ask). To put it in perspective, the July silver contract is backwardated. The bid on spot silver as I type this is 22.27 and the ask on the July future contract is 22.23. $0.04 is the decarry, which is about 0.2% or annualized the cobasis is about 0.8%.
For the remainder of this article, we focus on the ETFs.
The prospectus of each ETF explains the process by which an Authorized Participant (unlike carrying gold in the futures market, the ETF arbitrage game is by invitation only) can create and destroy shares. GLD shares can be created or destroyed in blocks of 100,000 shares (about 9668 ounces). When shares are created, more metal is added to the inventory holding. When shares are destroyed, metal is removed.
Creating shares is done by the arbitrage: buy gold bars / sell GLD shares. This is profitable when GLD is trading above net asset value (in this case 0.09668 ounces per share). The gap is closed by repetition of the trade, until the spread is too small to continue. Conversely, it is profitable to destroy shares when GLD is trading below net asset value. That arbitrage is: buy GLD shares / sell gold bars.
Arbitragers profit from a spread in the market, and their action closes the very spread from which they are profiting. Arbitragers care nothing about price. They care only about spread and, even more importantly, changes in spread.
OK, but how does this help us understand the ETF holding data? Armed with the insight of this theory, we ask the next question. What would cause the spreads to change?
Often, traders in the markets will act so as to keep spreads narrow. For example, before buying GLD many people will look at its price to net asset value. If the premium is high, they may buy gold in a different way. Another example is that anyone with an account that has access to both futures and equities can buy a future and sell GLD or vice versa. These trades will tend to compress the spread and will not result in any change in inventory in GLD.
Nevertheless, it if there is relentless buying of GLD, then this will push up its price. The result is that GLD will be sufficiently above gold metal, and an Authorized Participant will jump in.
I often write about cases that are counterintuitive. However, this is one case where the first assumption is not too far from what happens in the market. Relentless buying of an ETF relative to the rest of the gold market does cause inventories to accumulate in an ETF. The take-away from this article is that it is more complicated, and there are other mechanisms. For example, reluctant selling of GLD in a falling gold market can have the same effect of inflows of metal.
It is important to underscore that the quantity of gold is, for our intents and purposes, fixed. It can be moved around but is not created or destroyed by any of these trades. The increase in inventory in GLD does not tell us anything about the state of the gold market; it merely means that gold moved out of somewhere else in the market.
Rising ETF inventories tells us about the relative demand for metal in that form relative to all other forms. What does it mean if higher demand for GLD than gold bars or gold futures causes metal to flow into the ETF?
GLD is the easiest form of gold to own for the retail investor, and for many people, especially in retirement accounts, it may be the only way to own bullion. Measuring GLD flows can gauge sentiment among people in this segment. The only problem is in the interpretation.
Is retail the “dumb money” or the “smart money”?
I believe that in 2013, retail traders have been relatively reluctant to sell SLV compared to GLD. Unlike in GLD, it has not been as profitable to destroy SLV shares and so the number of ounces held has been moving sideways since late 2011 (though it may be breaking down now). Is this capitulation in gold? Is it a sign of strength in silver? Is it the harbinger of capitulation yet to come in silver?
For all of 2013, I have been bearish on silver in gold terms and have been calling for a rising gold:silver ratio. The ratio has moved up 10 points so far, and I do not believe it is over. My personal assessment is that market participants have reached a major low in gold sentiment. It feels like capitulation and despair in gold. But somehow in spite (or because) of this and despite silver’s bigger price drop, traders still cling to hope against hope in silver. Against a backdrop of credit stress and falling industrial production worldwide, this seems a risky bet.
If indeed traders have been fighting the market with long silver / short gold arbitrage positions, their unwind of this position will result in a sharp increase in the gold:silver ratio and likely another sharp drop in the silver price.


GLD has around 50% institutional investors whereas for SLV it is around 26%. I also note that Bullion Vault, GoldMoney & Bullion Management Group (which are retail investor products) are only showing sub 4% drops in holdings from 31 Dec 2012 compared to the +15% drops for the big gold ETFs, so I think retail investor is strong hands while institutional is weak is part of the story.
I think also some of the decline is maybe moves by people to take gold out of visible stocks and into private stores/vaults to avoid any potential future Cyprus haircut or MF Global type risks.
The Authorized Participants (APs) in GLD and, to a letter extent, SLV have been redeeming EFT shares to obtain physical gold, which explains the ongoing liquidation. The causal circle includes retail investors bailing out, but I think it’s wrong to start it there.
All of the bullion banks are APs; there are a few others. What they are doing with this physical is open to debate. Some candidate ideas are (1) your carry trades, newly taken; (2) closing previous short positions (really the same thing, just shifted in time); (3) moving it along to Asia at a premium. And, of course, (4) all of the above.
In theory redeeming GLD shares should work to lift the share price, but institutions with deep pockets can manipulate GLD as easy, and I think easier, than Comex futures. (BTW, EFT shares can be used to settle Comex futures contracts.) In theory, GLD is just a passive trust and not “managed” but, to correlate with the spot gold price, it does get “rebalanced.” There is plenty of opportunity for a bullion bank/AP to work prices in their favor.
The inventory draw-down in GLD and on the Comex have been fascinating to watch. The open question is how far they will go, and what happens if they approach zero.
Bron: thanks for your thoughtful comments. I would add one thing, which is GM, BV, and BMG are not only more retail oriented but less intended as trading vehicles.
wmbates: the carry trade I discuss does would not be increasing as the basis is falling (which it has been for a while). Think spread and the desire to profit by arbitraging it (and thereby compress it). The gold basis has been falling since the start of the year, and accelerating in February. The silver basis began falling soon after. There is a negative carry in July and September silver and the carry for December has fallen under 0.2% (from 0.6%).