
Like Dripping Silver Icicles
I don’t typically emphasize price charts in analyzing the market, however something unusual has been happening in the spot (physical) silver market. It did not happen in the silver futures market, nor in the gold market. I have been bearish on silver because of its supply and demand fundamentals, and the price action shown below adds a new dimension.
Let’s take a look at a candlestick chart. Candlestick charts show the open, close, and price range during a particular period. The region between the open and close prices is shaded. Green means that the price rose during the period and red indicates it fell.
In this chart, each candlestick corresponds to one hour. The numbers at the bottom are dates. The chart shows from July 17 to July 25, 2014. As with all charts in this article, times and dates are Arizona USA time (PDT).
Silver Hourly Candlestick Chart
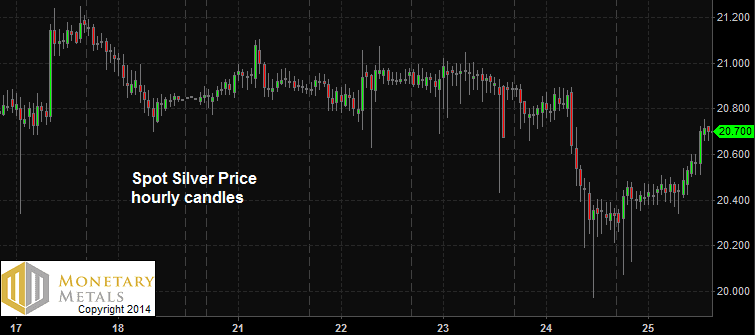
Notice the “icicles” (chartists often call them hammers or hanging men) dripping all over the place? They occur at different times of the day, including normal market hours in New York, Europe, and Asia, and they aren’t mere artifacts of market open or close, or illiquidity. I have not noticed them with such frequency before in silver. What are they?
Each one is a brief but dramatic price drop. If both the drop and the recovery occur within the period of the candle, then the drop will not appear shaded.
If you zoom in to one of them, using one-minute candles, they still look the same.
Silver One-Minute Candlestick Chart
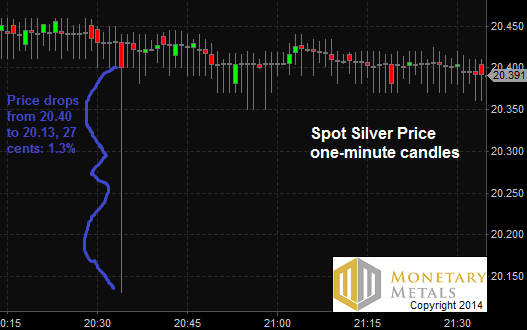
This one had a 1.3% price drop. The biggest this week was over 1.6%.
Let’s zoom in further. In this next chart, each tick mark is a price quote. There can be multiple prices in one second, or several seconds may elapse between.
Silver Price Tick Chart
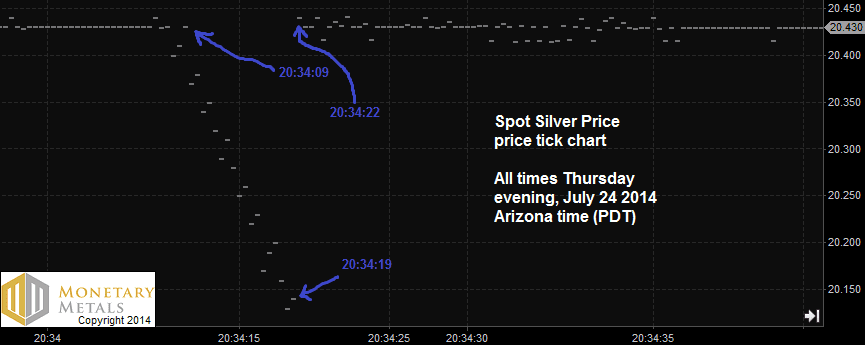
The whole cascade down occurs from 20:34:09 to 20:34:19, or 10 seconds. Note that there are no quotes after that until 20:34:22, or 3 seconds later, when the price is back to its prior level.
Unfortunately, I don’t have bid and ask data for this period. If you have this data, please email me or contact me with the form on the Monetary Metals site.
It looks like a few orders to sell at the market—i.e. on the bid—punched through the thin bid stack and found what existed below. Air. Sellers stopped entering orders for a while. Finally, the first buyer entered a buy at the market order—i.e. at the ask—and the price jumped back up to its prior level.
Let’s take a brief look at how the bid and ask work. In a live market, there is no such thing as a monolithic price. There are always two prices. If you want to sell now, you get paid the bid price. If you want to buy, you pay the ask price.
The bid price is not exactly synonymous with “buyers”. The typical buyer wants the goods now, and pays the ask price. However, a particular kind of buyer puts in a bid, that is a price to buy, which is below the current ask price. This buyer is equally content getting filled, or going home with his cash instead of the goods.
He is typically an arbitrager. He is profiting from a spread between two prices. He buys in one market and sells in another. In the Monetary Metals Supply and Demand Report, we frequently discuss the warehouseman. The warehouseman buys physical metal and sells a futures contract. He is not speculating on a rising metal price, but earning the spread—called the basis—between spot and futures prices. There are other arbitrages, such as buying in London and selling in Asia.
The key point is that the arbitrager is straddling a small spread. He is sensitive to price. If he can buy for X, then it’s worth his while. But at X+1, it’s no longer profitable (or profitable enough).
We should keep this context in mind as we consider these mini-crashes. It looks like the bid disappeared. It seems premature to generalize, and say that the silver bid is disappearing. But it’s more than can be explained by glitches or coincidences. The question is what has happened to the silver arbitragers?
It could be that their source of funding has dried up. If you can’t borrow money to finance the trade, then you can’t buy silver to store it while you wait to deliver it. This explanation is not so convincing, as I don’t think that credit market is so tight right now.
Perhaps it’s not tight credit in general, but credit is withdrawing from commodity arbitrage trades. This is possible, as there have been several big banks closing their commodity finance operations. Recent uncertainty with the Silver Fix, the withdrawal of Deutsche Bank, and a fresh wave of manipulation lawsuits may all have helped pushed big participants out of the market.
Another possible explanation is that arbitragers are less willing to use credit, or use balance sheet capacity, for silver trades. Silver may simply look less attractive than other opportunities.
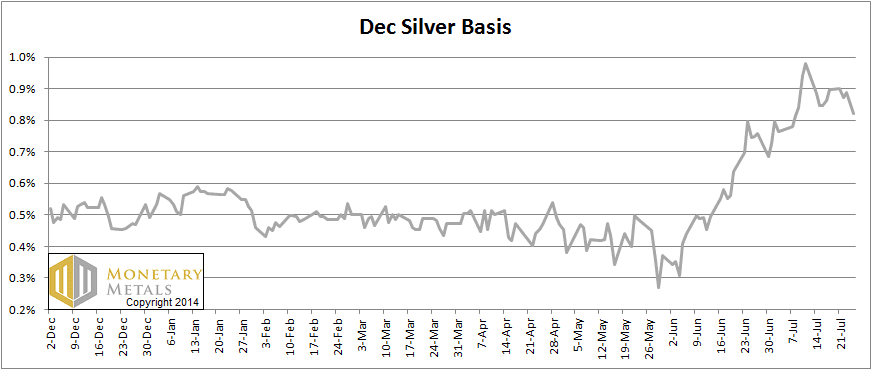
One thing is for sure. There is currently an attractive opportunity to carry silver. If you buy silver and sell a December future, you can earn over 0.8% annualized. This is a graph of the December silver basis.
December Silver Basis
Silver is normally a liquid market, but these icicles are showing us a picture of an illiquid market. They are also suggesting that there are no good opportunities for buying silver metal.
That’s what the arbitragers are doing: buying metal to exploit opportunities. If they are not bidding, it may be because they don’t have good opportunities. If so, then all that’s left is speculating on its price.
The bid price of silver for the December silver contract is now about 7 cents above the ask price of spot. Speculators use leverage. That’s the whole point of using futures compared to any other instrument or the metal itself. Leveraged speculators are pushing the price up, and the arbitragers are not able to keep up. The net result is the gap between physical and paper has been widening for a long time—with paper going up relative to physical. This spread hit a multiyear record on July 11.
What happens when faith in the “silver to da moon?” story dies out? Sooner or later, speculators will give up on waiting for $200 or even $50. A few orders to sell at the market could push the bid down to a whole different level. There is one risk factor to precipitate this, lurking right now.
Here is a graph of silver volatility. It has been declining for a long time. A spike in volatility will cause increased margin requirements for speculating on futures, and forced selling as a consequence.
Silver Volatility
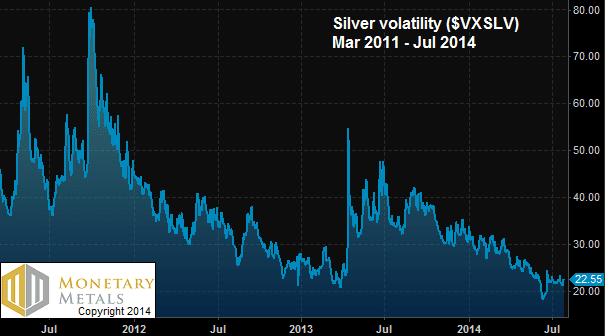
In general, volatility is inversely correlated with steady or rising prices. For example, everyone looks at the VIX for the stock market. That chart does not look too dissimilar to this one. It’s something to consider. If silver trades at $20.70 with low volatility, what could happen to the price when volatility quadruples?
Whatever the cause of the silver “icicles”, demand for silver metal is not robust. The icicles look crashy to me.
© 2014 Monetary Metals
Terrific article Keith.
So many people talk manipulation, short supply, coiling chart signals, monthly bullish MACD crossovers etc etc and spruik moon shots
Meanwhile silver is still below trend on a monthly chart, gone sideways for a year on a weekly, and daily looks a bit crashy to me too.
Your basis/cobasis analysis shows a different picture and is the clearest picture out there.
Thanks
BTW where does the option expiry coming up fit into this picture ?
SW
Silver must be difficult for you because you have to kind of force it into being a monetary metal. Because as a monetary theorist as much as you would like to relegate it to the industrial side to allow the Platonic intellectual purity of the Gold standard to reveal itself, you can’t. And to qualify as a monetary metal, silver must have a very high stock-to-flow ratio, despite all of the evidence to the contrary.
So, “supply and demand fundamentals”? Please.
By “supply and demand fundamentals” you mean as inferred from the actions of speculators and arbitrageurs trading paper back and forth betting on price action in a global bucket shop. If I counted as physical supply the billions of ounces of fraudulent leases on which that trading is based I would be bearish on silver too.
Keith, where do get the data from for the “Silver Price Tick Chart”?
There is another way to interpret this (as there always is). Lack of price movement could also indicate there are no sellers.
Bullion dealers have been selling out of available stock every day for many months. A new trend on craigslist is all the offers to buy silver of any kind, some of the posts offering above spot price.
My own prediction is a bottom within 1 trading day either side of Aug 12 and a top on Sept. 9 at around 26.
mossmoon,
Silver has the highest stock-to-flow ratio, second only to gold. Where did you find data to back your sentence?
Keith,
the same (or bigger) icicles occurs in the gold trading market, but within milliseconds instead of seconds.
It could be interesting to write the same article on gold.
$VXSLV is about silver ETF volatility. We still need to be sure ETF market and silver spot market are tightly bound, and **will remain like this.**
Keith ,
Amazing article. Clear and concise. Articulated with such insightfulness and care for the common reader.