
Monetary Metals Outlook 2015
We have consistently been making the contrarian call for a falling silver price and a rising gold to silver ratio for years. This leads to the logical question. Are we ready to change our call yet? This being the start of a new year, we wanted to take the opportunity to look at this question in more depth.
In fourth grade math class, Miss Jennifer doesn’t want the kids to just write “42”. She wants to see the work all written out. It’s not so valuable if we say “silver to $10” or “silver to $100”, without saying why.
This report shows our long division work.
How Not to Think about Gold
It may seem odd to begin by discussing how not to do it. However, these approaches are very common and many of our readers start with this perspective.
There are several popular approaches to analyzing gold. If you visit any alternative investing or gold site on any day, you will find conspiracy theories about price manipulation, rumors and out-of-context-factoids, and finally mining production and manufacturing consumption. None of these approaches are helpful. They can confuse long-term holders, and cause traders to make costly mistakes. This is especially true over the past several years.
We have written a lot to debunk claims of price manipulation claims (here is one article, there are many others on the Monetary Metals site). Broadly, they fall into a few categories. One, central banks are selling gold. Maybe, but what explains the even-larger price drop in silver? The banks don’t have any silver. Two, banks are short-selling futures naked. This would cause backwardation (we discussion backwardation below). It would also cause expiring contracts to move in the opposite direction than they actually do. Three is just magical thinking. For example the bigger your position, the more you control the price. How? Of course markets don’t work that way.
We would put rumors, London gold export and Indian gold import numbers, and news into the same bucket. Even when factual, these items are the investing world’s equivalent of an attractive nuisance—they can lure you to financial harm. Most importantly, one should never trade based on what the Fed has done (increase the quantity of dollars) or will do (increase it even more). That is not what drives the gold price, and besides this story is always there even when the gold price drops.
Finally, there is a lot of information out there on electronics and jewelry consumption, and mine production. However, gold and silver cannot be understood by looking at small changes in production or consumption. This is because virtually all of the gold ever mined in human history is still in human hands (and to a somewhat lesser extent for silver). No other commodity comes even remotely close. The US Geological Survey estimated the total gold stocks at 171,300 metric tons at the end of 2011.[1] We believe this understates the reality, perhaps by a large multiple. People have been hiding gold from their governments and tax collectors for thousands of years. Gold has always been the sort of thing that most people would rather keep quiet about. It defies any systematic inventorying process.
In any case, annual production is a tiny fraction of this. Reuters reported an estimate of 2012 production of 2,861 tonnes.[2] This is just 1.6% of then-existing stocks. In other words, it would take 61 years at current production levels just to produce the same amount of gold as is now stockpiled. In regular commodities, this same ratio—stocks to flows—is measured in months. We just don’t hoard wheat and oil for the long term, for obvious reasons. Nor even iron or lumber or other durable materials.
How We Think About It
The implications of this are extraordinary.
If total gold mining is 1.6% of gold inventories, then small changes to that 1.6% are not likely to have much impact on the gold price.
All of that stockpiled gold represents potential supply, under the right market conditions and at the right price. Conversely—unlike ordinary commodities—virtually everyone on the planet represents potential demand. A change in the desire to hoard or dishoard gold, even a small one, can have a big impact on price.
Three, there is no such thing as a glut in gold. Through thick and thin, through rising and falling prices, for thousands of years, the market goes on absorbing whatever the miners put out. Gold mining does not collapse the gold price, as oil drilling or copper mining does, when inventories accumulate.
Why would people be willing—not just today, in the wake of the great financial crisis of 2008 and unconventional central bank response, but for thousands of years—go on accumulating gold and silver?
There is only one conceivable answer. It’s because gold is money. Compare gold to oil. The marginal utility of oil—the value one places on the next barrel compared to the previous—declines rapidly. What would you do if you had to take delivery of 100 barrel of oils, or 1,000 gallons of gasoline?
Gold doesn’t have this problem. People are happy to get the 1,001st ounce, and accept it on the same terms as the 1,000th or the 1st ounce. It doesn’t hurt that you could carry 1000oz in a backpack, nor that you can find a ready market for it, anywhere in the world from London to Lisbon to Lagos to LA to Lima to Laos.
If gold is money, what is the dollar? The dollar is a small slice of the US government’s debt. It is a promise to pay, though it comes with a disclaimer that says the promise will never be honored. The dollar is credit, whose quality is falling. What does that mean for our discussion of the gold price?
It turns it inside out.
We don’t look at it as a gold price of $1,200. Instead, we firmly insist that it’s a dollar price of 25.2 milligrams of gold. This is not merely semantics. It is a paradigm shift—easy to say, but harder to get your head around. The advantage of this perspective is that you can see the market much more clearly.
If you are in a rowboat, tossing about in stormy seas, would you say the lighthouse is going up and down? If you have a stretchy rubber band, would you use it to measure a steel meter stick? Can you say that the steel is getting shorter, as the elastic stretches? No, the lighthouse and steel are stable but the waves and rubber band are not.
When you say “gold is going up”, you can’t help but think you are making a profit. But if you say “the dollar is dropping like a brick” then you realize. Sure you may have more dollars, but those dollars are worth less than they were. You won’t be so tempted to spend down your savings, merely because the value of the dollar fell.
You cannot profit merely by holding gold. You can avoid losses (which is a good thing, in our opinion). We go further. We advocate that everyone keep their net worth in gold, and measure profit or loss based on gains or losses in gold ounces. If you had 100oz and later you have 110oz, then you got richer. If you went down to 99oz—even if the price of gold is higher, and your gold is worth more dollars—you have suffered a loss. Even if you are not a hundred percent convinced, consider this easy exercise. Just divide your dollar net worth amount by the then-current price of gold. It’s a good discipline to get into.
In this light, it’s clear that you can profit from holding silver, if silver goes up. For example if the silver price begins at 0.4g gold and it rises to 0.6g, then you have made a profit of 0.2g or 50%. It is about 0.4g right now, and it was last at 0.6 in 2012.
You can sometimes profit by going long the dollar. It is in a century-long downtrend, but that doesn’t mean there aren’t corrections along the way. For example, the dollar hit a low of 16mg gold in 2011. Since then, its rally has been impressive. It has hit a recent high of over 27mg, a gain of 41%.
At other times, you can profit by shorting the dollar with leverage, for example buying gold futures on margin. Suppose you have 100oz gold, or $120,000 today. You need about $6,000 in margin per contract to open a position. Your stake of $120,000 lets you buy 20 futures, each representing 100oz. Suppose that the price of gold goes up by $60. You sell your position, at a profit of $60 X 100 X 20 = $120,000. At $1,250 per ounce, this is enough to buy 96 ounces. Not a bad profit, if you started with 100. Of course, the risk is extreme if you use leverage like this.[3]
How We Look At the Gold Market
We think of the market as the coming together of 5 different primary groups.
- Buyers of metal. These are typically hoarders. Unlike buyers of other commodities, they don’t have to incorporate it into a product and sell it to make a profit. So there is no particular price that is necessarily too high, other than whatever their notion of a fair price is at any given moment. It’s worth noting that jewelry manufacturers are mere intermediaries, buying gold to put into product that is typically held owned for a long time by the buyer.
- Sellers of metal. They are dishoarding, for whatever reason. They may think the price has hit a high enough level to attract their greed, or a low enough level to activate their fear. Miners are a subcategory of sellers. They are price takers.
- Buyers of paper (e.g. futures. These are speculators, with three key differences from buyers of metal. One, they use leverage. Two (for that reason and others) they have a short time horizon. Three, their exclusive goal is to make a trade for dollar gains.
- Short sellers of paper. Not nearly so big a group as popularly imagined, there are people who take the two lopsided risks of (1) shorting something with limited profit and unlimited loss potential and (2) fighting a 100-year trend. These people are nimble and aggressive and certainly play for the short term.
- Warehousemen, aka market makers. If few people are willing to bet on a rising dollar (i.e. falling gold price), then who sells gold futures? Aren’t futures a zero-sum game, with a short for every long? Enter, the warehouseman. He stands ready to carry gold for anyone who wants future delivery. If you buy a future, you are signaling that you want gold, not to be delivered now, but at some date in the future. For a profit, this group will sell it to you. How do they do that? They buy metal in the spot market and simultaneously sell a contract for future delivery. They don’t care at all about price, as they have no exposure to price. They respond to spread. Suppose they can buy gold in the spot market for $1,200 and sell it for April delivery for $1,208. That is 0.7% for three months, or 2.7% on an annualized basis—pretty attractive in the zero-interest world of Ben Bernanke and Janet Yellen.
It is important to keep in mind that virtually all of the gold ever mined is in someone’s hoard. There is no such thing as a glut, and also no such thing as a shortage. However, the market can experience relative abundance and scarcity and the spreads of the warehouseman provide a good signal to see it.
If there is a big spread, such as in our example in #5, that means two things. One, speculators are bidding up futures contracts. And two, the marginal use of gold is to go into the warehouse. This is a sign of abundance.
Normally, the price in the futures market is higher than the price in the spot market. This is called contango. Contango means it is profitable to carry the metal, which is to buy a metal bar and sell a future against it. However, the spread can invert and it has many times since the crisis of 2008. When it is inverted—called backwardation—it is profitable to sell metal and buy a future. Decarrying metal is, by conventional standards, risk free (it’s not, see below). It should never happen in gold, as it is a sign of shortage and there is no such thing as a shortage in a metal which has been hoarded since ancient times. Backwardation is a signal to the warehouseman to empty out the warehouse. The marginal supply of metal is coming out of the warehouse, as carry trades are unwound.
This is the only way to analyze supply and demand fundamentals for the monetary metals. They are not consumed. They have a stocks to flows (i.e. inventory divided by annual mine output) ratio measured in decades. They are not bought to consume, nor based on a profit to incorporate them into a product that has to be sold to meet a price point.
These five market participants interact to form a constantly changing dynamic. It is this dynamic that we study when we look at spreads between spot and futures, and changes to these spreads. Monetary Metals has developed a proprietary model based on this theory, which outputs the Fundamental Price for each metal. This is updated as the market changes every day.
We have published more on the theory.
Macroeconomic Conditions
For a few years, the market has been in a mode of soft to declining fundamentals. There are, of course, price blips. In each blip, we see the same pattern over and over. As price goes up, abundance of the metal rises. Scarcity declines. Then the price subsides and the abundance drops again. It is a pattern of speculators testing the market to see if it has the magic go-juice.
For over two years, we have been calling this publicly. On every price blip, a chorus of voices from the gold and silver communities has cried “break out!” But it has not been so. We have been publishing the data, and our analysis. “This is not the break out you’re looking for,” quoth us (paraphrasing from Obi Wan Kenobe in Star Wars).
Needless to say, this is not the behavior of a market price that is shooting, or will soon shoot, higher. It is, however, what we have today as the year turns 2015.
Let’s begin our macroeconomic analysis by looking at the gold to silver ratio. It has been in an unmistakable rising trend since 2011. The elephant in the room is declining manufacturing and production that consumes commodities. The making of physical stuff is declining, and silver is more sensitive to this and declines with it. Silver, unlike gold, is consumed to some extent in manufacturing. Gold’s high price ensures that a lot less is used in electronics, and most of that is recycled.
Along with silver, the prices of most other major commodities have been trending down. Some have been doing this for years, for example copper has been falling since early 2011. Oil held its price until the 2H 2014, but is now making up for lost time.
The backdrop is the ever-present risk of debt defaults. A number of high profile debtors defaulted in the global financial crisis including the country of Icelandic banking system, Bear Sterns, Nortel Networks, and others. Subsequently, Greece defaulted and this led to the banks of Cyprus collapsing. Contagion is very real, in a world where every financial asset is someone else’s debt, creditors are leveraged, debt is rising exponentially, and everyone only wants the borrowing orgy to continue forever.
The conventional remedy is to push down the rate of interest. Central banks have done this aggressively, and we believe it is now like a snowball pushed partway down the hill. It is rolling and getting bigger of its own weight and accelerating out of control of the person who began pushing it. Interest rates are now obviously pathological. They have long been pathological, but now even the most diehard Monetarist cannot just cling to the stale rationalization of falling inflation expectations. The ten-year bond in Japan yields 0.33%. Bonds out to five years in Germany have a negative yield (and Switzerland is far worse than that).
This spread between American interest rates and that in other major countries is a fundamental that helps drive currency moves. It pays for someone to borrow in these currencies (yen, euro, and franc), exchange them for dollars and buy Treasury bonds. They can pocket the interest rate differential. The drop in the local currency against the dollar is just a free bonus.
The other currencies are unmistakably falling, not even counting the Marxist basket cases like Venezuela and Argentina, or the incipient default cases like Russia.
This trend contributes to the same falling interest rate trend in the US. It is falling out of the control of the Federal Reserve. To be sure, they cannot allow the rate to rise. But that does not mean they want or need it to fall as fast as it likely will begin to fall, when it really gets going.
A falling interest rate is enormously destructive. It creates massive capital gains for bond holders, and the rising bond price is propagated to other markets. These gains are not from rising productivity. They are from monetary policy, which cannot create wealth but merely redistribute it. These gains come at the expense of bond issuers. Bond issuers are, in essence, short their bonds. If you short something and it goes up, you incur losses (we acknowledge that this is not recognized in current accounting practice).
What do you call an environment characterized by falling commodity prices (if not retail consumer prices), failing debtors, and falling interest rates? Now add to that widening spreads between junk and Treasury bonds for a full year and counting.
Most people would intuitively call it deflation.
It is not a trend that, at the moment, is conducive to a rising gold price—and certainly not a rising silver price. It is a trend of dollar debtors getting squeezed, and hence bidding up dollars that have become scarcer. Gold is easy to sell because there is such a small bid-ask spread. Selling other assets involves much bigger frictional losses.
Not the Drivers of the Big Price Move
Speculators view gold and especially silver as just a speculative vehicle to make more dollars. They can pull the price pretty far, at least for a while. Like stretching a big rubber band, however, it gets exhausting to keep up the force. Eventually if they’ve gotten the trend wrong, they must let go. In September they began letting go of silver. At the end of October and into November, they let go some more.
If they let go all the way, the silver price certainly could drop a few bucks. Or, alternatively, if they decided to buy silver for another speculative run, it could go up several dollars. These are not what we are discussing when we talk about a big price move. That sort of move will be neither big nor durable.
We want to know what will cause silver to go back to $35, much less break past $50. What will push gold to $2,000, much less $5,000? The cliché answer is more central bank money printing, which drives another boom and commodity speculation and rising prices for everything. With the inflation trade back on, then the prices of the metals could recover their lost levels of 2011 and continue rising.
We would not put capital in harm’s way betting on this thesis.
For one thing, some commodities like oil and iron now have structural and likely durable oversupply conditions, thanks to dirt-cheap financing of extraction and refining businesses fueled by high commodity prices, in the wake of central bank policies since 2009. Also, users of commodities are saturated with debt, and there is not going to be a repeat of the Great Wall-Building Boom of China[4]. Demand is depressed from 2009-2013 levels and there are no drivers on the horizon to overstimulate it again. At the same time, people in countries with collapsing currencies represent declining demand for world commodities—in proportion to the declines of their currencies.
Before we get to our numbers for gold and silver in 2015, we have one other topic to address.
Be Careful What You Wish For
Most gold bugs would love the gold price to rise rapidly to $5,000 or more. We would first like to point out that this means the dollar drops from 26mg to around 8mg. The whole world runs on dollars. Think what will be happening to people, pension funds, insurance, banks, employers, etc. if the dollar drops more than 2/3 in a rapid spike down.
It is tempting to look around, see the fat cats driving their Ferraris or else being driven by their chauffeurs to bars on the roofs of skyscrapers, jetting around the world, wearing complicated Swiss watches and Italian suits, and think “I’d like to be there.” The fantasy is, “If only gold goes to $5,000 or $10,000, then that will be me.”
We don’t think so. If the price action happens slowly, say over 10 years, it will represent a steady erosion of the dollar and of the world’s capital base. Holding gold will keep you (mostly) safe from that erosion, but will not make you rich.
If it happens rapidly, it will be something else entirely. The collapse of 2008 was ugly, until central banks put it on pause. They agreed to an unfathomable price in their Faustian deal with the devil. When the collapse resumes, it will make 2008 look like a dress rehearsal.
Those bars will be closed. There will be Ferraris for sale cheap, but with refineries and gas stations failing, getting fuel could be a challenge. Getting dollars out of your bank account to buy the fuel could also be a problem. The mood on the street will be ugly, and one may be better off not flaunting a Ferrari openly. Even today, in the relative calm of the current boom, many municipalities are having a hard time keeping up vital services such as police and fire. They will find it much harder when they can’t keep on borrowing.
Something will inevitably happen to remind people that gold is not just for hedging inflation or speculating for dollar gains. To understand, put yourself in the position of a citizen of Cyprus in February 2013. On one Friday afternoon, you had what you thought was a few hundred thousand euros deposited in a bank.
And then, on Monday morning, you didn’t.
It turned out that the Cypriot banks had invested in Greek government bonds. They had long since lost your money but continued to operate in a state of insolvency. As deposits drained away, they got to the point when they could no longer keep up the pretense. People who had their euros locked up in closed banks nervously waited. There were tight limits to withdrawals. And haircuts for depositors—losses shared with other classes of creditors. Virtually everyone on the island was in this vulnerable and terrifying position.
Those few Cypriots who had previously bought gold, found they could easily get on a ship and go to the mainland where conditions were normal. We spoke with a gold bullion dealer in Nicosia, Cyprus. Very few had bought gold. Most did not realize their peril (or want to see it).
The virtue of owning gold, for Cypriots, was not in the hope its price would rise. It was more elemental than that. Gold is not someone else’s liability. It is a lump of metal, which means that it cannot default. It is not subject to a negotiation of the International Monetary Fund, the European Central Bank, and the European Commission. Unlike the so called Troika, gold will not sell you up the river.
If you own it on Friday, you still own it on Monday and it gives you the freedom to do as you please.
Events are coming that will remind people of this. We think these reminders are likely to be very pointed. When hundreds of millions of people in Europe, South America, and possibly even North America too, wake up one day to the reality of losses on what they had assumed was money safely in the bank, the buying pressure in gold and silver will be truly ferocious. Notably, the selling will not be comparable. There will be some fools who are eager to book their illusory profits as the price rises. But most won’t be eager to trade their metal for bank deposits of unknown provenance and unknowable risks.
This will be a time of probably exponentially rising price combined with exponentially rising backwardation. That is, the gold futures market will cease to work.
It will be a time of woe, though a bit less horrible for those who own gold compared to everyone else. Not a time of 108th floor bars, $50 cocktails, and jetting off to London for the weekend.
We emphasize that the endgame of the dollar is not imminent. We will continue to update the picture as events inexorably play out.
We just published an article about the coming collapse of the Swiss franc. That would likely shake things up. The yield on Swiss bonds has negative out to the 15-year bond. That’s the end of the road.
Our Numbers
Gold closed the year 2014 at $1,184. The Monetary Metals Fundamental Price closed about 30 bucks higher. Here is a graph of the market price overlaid with the Monetary Metals Fundamental Price.
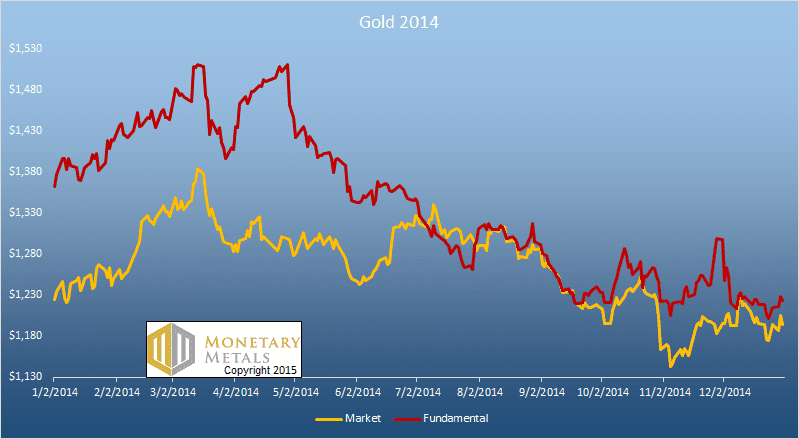
You should be able to see two things clearly. The price of gold rose and then fell, ending a bit below where it started. Also, gold has been underpriced most of the year, though in the second half not nearly so grossly as in the first. Today as of the final edit of this report, it’s still underpriced, by about $45.
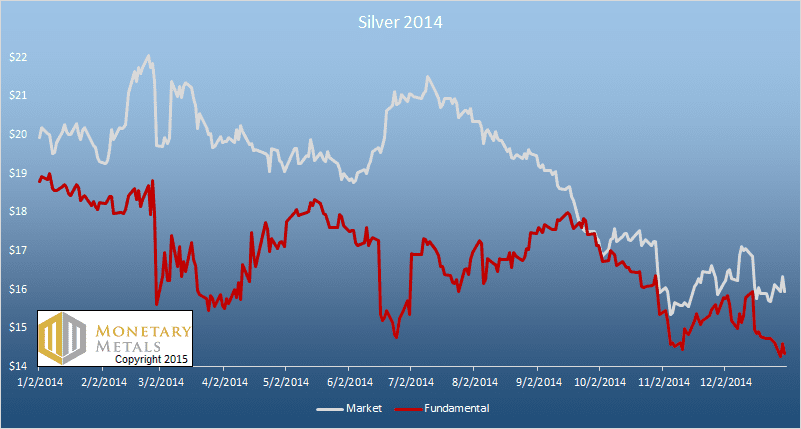
Silver closed at $15.69. The Monetary Metals Fundamental Price closed about 11% lower. Here is a graph of the market price overlaid with the Monetary Metals Fundamental Price. Silver is overpriced, by about $2.35 as of the publication of this report.
The gold to silver ratio closed the year around 75. Our model suggests it could be headed to around 85. Here is a graph of the market ratio overlaid with the Monetary Metals Fundamental Ratio.
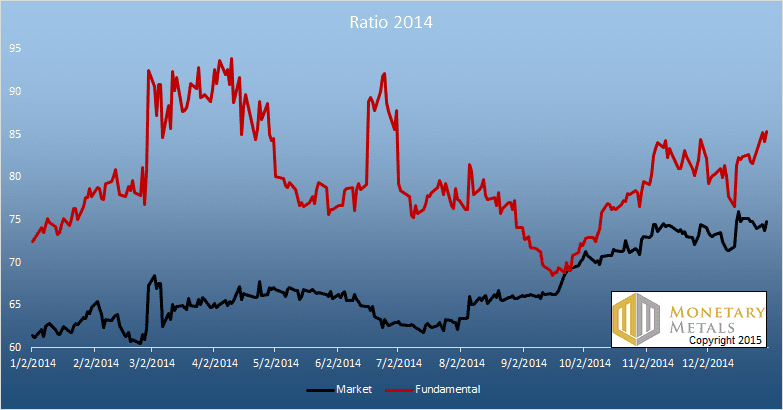
If silver is overpriced, then that likely means the ratio is underpriced (being gold / silver). 2014 was a year when the ratio was below the fundamental, though less since October.
Fundamentals can and do change. Look at gold turning down sharply at the end of April or the ratio turning up sharply in the middle of September. So what do we expect this year?
Our Call
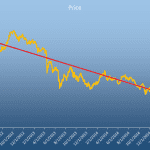
One approach to the question of price is to draw a line, extrapolating the past trend into the future. Here is the graph for gold.
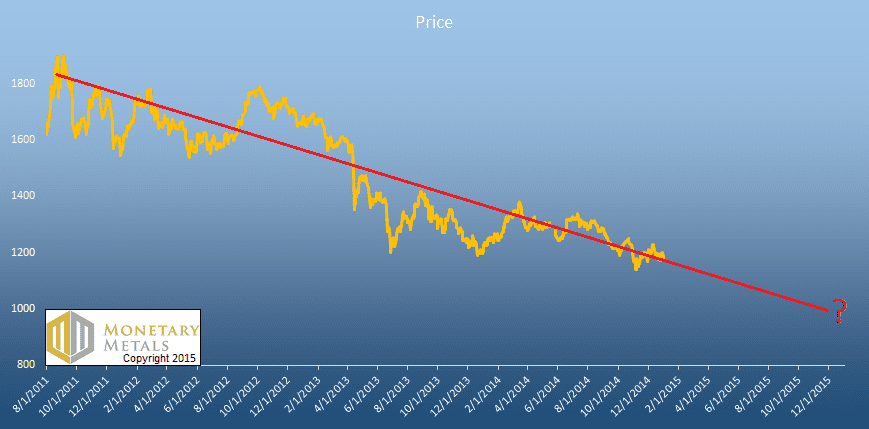
This line would give us a gold price around $1000 at the end of 2015. If we did it for silver (not shown), we would get around $10.
We don’t think that most traders would do something this simple (though some mainstream anti-gold commentators might). Our point is that technical analysis is about looking at the trend. We do not believe that the past trend in the gold price is likely to be a good predictor of the price in the future, because the past drivers of the price won’t be operative in the future.
Another approach is to plot gold against M1 money supply. Here’s what that looks like.
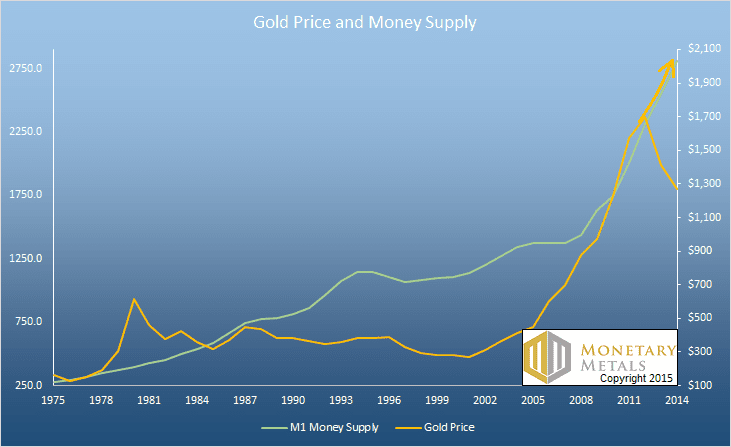
This implies that the price already ought to be well over $2,000 and unless central banks put down their keyboards and back away, it will be hundreds of dollars higher by the end of 2015.
We don’t believe this approach, or any approach based on the quantity of money, is valid. At best, one can find correlation without causality. For example, some people thought that there was a correlation between the winner of the Super Bowl and the presidential election (an NFC win was supposed to forecast a Democratic president). We think this chart proves there is no causal link between money supply and the gold price.
Other analysts attempt to calculate a gold price based on inflation—by which they mean rising consumer prices. They say gold should do well in inflation. And, they say that it should be coming any day now because look at how fast the money supply is growing. We don’t think that the money supply drives consumer prices any more than it drives the gold price. The crashing commodity markets over the past few years—notably oil in the second half of 2014—should once and for all debunk this idea.
Gold is not purchased for consumption. So even if consumer prices were rising, that does not mean that the gold price must rise. Or, vice versa. Consumer prices are influenced by numerous variables such as efficiency of production that have nothing to do with gold.
Many fall back on the fundamental argument for gold and silver. Paper currencies are now being debased recklessly. Every central bank in the world has openly declared its intent to beat down its currency. This is true, paper currencies have been falling for decades. We believe they will all go to their intrinsic value—zero. There’s just one catch.
It doesn’t necessarily have to happen tomorrow morning.
So the past gold price doesn’t predict the gold price of the future. Any correlation between the gold price and macroeconomic indicators is temporary. And, we can’t trade gold based on the premise that paper currencies will meet their final fates. So where does this leave us?
We currently calculate Fundamental Prices of $1,319 and $15.10 for gold and silver, respectively. The current trend is a reaction to the previous trend. What was that? We call it the inflation trade. After 2008, central banks increased the money supply. Everyone believes that this is supposed to cause prices to rise. So they bid up everything. For example, oil rocketed off its low around $33 in early 2009 and was soon trading at $80. Silver had its low price well below $9 in late 2008. By spring 2011, it hit just about $50, or almost 6X higher.
Then, that trend ended. While the money supply certainly did not collapse, supply and demand fundamentals caused lower prices in one commodity after another. Copper, for example, peaked in early 2011. It is still sliding. Oil is the latest casualty.
If people bought the monetary metals because they thought to protect themselves—or profit—from inflation, then it was logical for them to sell the metals when they abandoned this thesis. And, forced by market realities, they did abandon it.
There is currently no evidence that scarcity is rising, and thus gold should shoot da moon. This does not mean that it cannot or will not happen in 2015, but that there is no reason to call it today.
Let’s take a step back and put this into perspective. The inflation trade started in 2009 and began cracking up in 2011. Call it two and a half years, maybe three. The next trend—call it the who-needs-money trend—has been going on for more than three and a half years. We say who-needs-money, because gold and silver are money, and right now no one feels they need it. They prefer government issued paper. Perverse though it may be, this is reality.
We have lots of reasons to expect that this trend will not simply continue for another year. Fireworks are beginning to occur in the credit markets, and some defaults—especially sovereign—could serve as a boot to the head, to people all over the world. The concussion could remind them why they do actually need money.
We may or may not get a rapid change in the prices of the monetary metals, at first. What we will get is a persistently rising cobasis (i.e. measure of scarcity). The pattern will change too. Instead of a dropping cobasis with each price blip, we will see a cobasis that rises with price dips and holds firm or rises on price blips. We will see the return of temporary backwardation to the near-month futures contracts, and it could spread to other contracts. We will see larger backwardations. When we have had them in the past year or two, they have been a few pennies in silver and under a buck in gold.
What will cause backwardation to increase in magnitude? Backwardation is when the market is offering you a profit to decarry your gold or silver. That is you sell it for dollars, buy a future, and get a little profit for the deal. Once the contract matures, you get your gold back. Backwardation grows when the reluctance to take this trade increases. What would cause someone to hesitate to decarry their gold?
It is the fear of the counterparty. The CME Group will tell you that their margin procedures ensure that there won’t be any defaults. Every day, dollar cash is transferred from the long to the short in each contract, or from the short to long, depending on the move in the price of the contract. No one is questioning the ability of a major bank to borrow dollars from the Fed to post margin if necessary. But that does not solve the problem of getting gold delivery from a contract. CME cannot assure that contract sellers can deliver metal.
To put it in other terms, the price of a gold or silver future can depart from the price of the metal in the cash market. CME margin process will, of course, apply based only on the price of the future. If the price of a future detaches from the price of metal, that is the market’s indicator that it expects counterparty problems.
Contrary to gold bug propaganda, this price divorce has not happened in any major way yet. Even in December 2008, the largest backwardation so far, the February 2009 contract was under 3% annualized backwardation, or less than $4. To a casual observer, the price of the future was still tracking the price of gold metal just fine.
Contrary to decades of government propaganda, all is not well in the monetary system. Banks may love the falling interest rate and endless bond-buying of the Fed. It is the same as welfare queens loving the dole. They do not benefit from it, and in fact are harmed. They are weakened, hollowed out. Their liabilities have increased with their assets, but there is a problem. The value of the assets is totally distorted—inflated—by the Fed’s actions. The liabilities, by contrast, are hard.
For example, surely the banks own some of the bonds issued by the shale oil producers. There is no doubt that many of those bonds will default. They were sold into the market when it was inconceivable to have an oil price below $50. What will these defaults do to the banks’ balance sheets?
The actual default events may not begin in 2015 (we are not junk bond analysts), but that is not the point. The market price of the bonds has dropped. That is a loss to the banks who hold them, whether they mark to market or not (and they would be hard pressed to justify not marking the losses based on hold-to-maturity principles, as losses are certainly coming). At some point, these losses will matter.
They may especially matter to gold owners who are weighing the profits they can earn to relinquish their gold for a few months vs. the risks of not ever getting it back.
When backwardation returns to the market, it will be a bullish signal for the price of the metals. It is interesting that in each case of backwardation so far, the backwardation has been cured by higher prices. This is because some metal was coaxed out of hoards, as some holders valued the dollars more than the gold. But ultimately, higher prices cannot fix the problem which is distrust of all counterparties.
Gold is the only financial asset that has no counterparty.
It is also the only commodity that is bought without regard to price. What is price, anyways? It is the number of dollars that can be exchanged for the good. A dollar is always someone’s liability, a bank’s or ultimately the Fed’s. If your reason for owning gold is to escape exposure to possibly-insolvent counterparties, then a higher exchange rate does not necessarily persuade you to give up your gold in exchange for that paper credit again. If anything, it confirms that you were right in your assessment.
Here is our bottom line. To anyone who does not yet own gold or silver, we offer the same advice as always. You should own some, period. Without regard to price. Though we think that buying gold now is likely to turn out to be a good deal.
To those looking to trade, at the moment this report is published you might buy gold for a quick trade. There is no case to buy silver.
We do think that it’s likely that declining credit quality and widening bond spreads will start mattering in 2015. This will cause a change in the current trading pattern. Higher gold prices will be the result. If Switzerland’s currency collapses in 2015, then all bets are off.
We see no rush to load up the truck just yet.
We will continue to chronicle the changing dynamics in the Monetary Metals Supply and Demand Report every week. Subscribers will be the first to see the shift described above.
It is important to note one caveat. As with equities, fundamental analysis does not help you time the market. Timing is not what we are trying to do. We are doing something that has become unfashionable.
We are interested in valuing the market. As September proved in silver, value does matter. At some point, it always comes back to the market with a vengeance.
© 2015 Monetary Metals LLC. All Rights Reserved.
[1] http://minerals.usgs.gov/minerals/pubs/commodity/gold/myb1-2011-gold.pdf
[2] http://www.reuters.com/article/2013/11/20/gold-mine-output-idUSL5N0J44T720131120
[3] As they say on those shows on TV when they blow stuff with dynamite, “don’t try this at home.”
[4] And skyscrapers, cities, rail lines, airports, malls, factories, etc.
")


Thanks Keith I like your unconventional, counter intuitive thinking. Makes a lot of sense to me and reflects reality, much better than most of the biased pro-gold bug wishful thinking out there. Will be following your reports with much interest for 2015.
Cheers
Paul
Unconventional ? This blog looks more and more like dan norcini’s articles…
Keith many thanks for this explanation as you filled in some gaps in my thinking. I struggle every day with the problem of maintaining real wealth/capital in this environment of quicksand and am very fearful of paper assets, despite their apparent relentless rise.
So I guess you are going to short silver with leverage big time : fair value at 14 USD and end 2015 at 10 USD ?
WOW! Two fantastic articles back to back!
Lead on!
Excellent analysis Keith. Thank you.
Keith,
If, at the current rate of production, it will take only 61 years to double the amount of above ground gold in the world, why is there not MUCH more total gold after thousands of years of production?
Because the invention of the internal combustion engine and derivative modern equipment and materials has increased the rate of worldwide annual production and gold that is able to be mined by an order of magnitude (probably more) http://goldratefortoday.org/world-gold-production-1900-2010/
All bets will be off indeed
Keith,
I read each of your reports with avid interest. Thank you.
Thanks for your comments!
RD: If you think we recommended shorting silver, much less doing it with leverage, may I suggest re-reading this and some recent Supply and Demand Reports? We never recommend naked shorting a monetary metal. You never know what some central bank may do overnight. We may recommend a long/short position in the two metals, but not naked shorting worse yet naked shorting with leverage.
stustev: Over time, the absolute number of gold ounces increases as does the rate of production due to an expanding global economy and improving mining technology. One of the interesting things about gold, however, is that one cannot just trade money for gold mining production. You need to find a viable ore body. This does cost money, but also time and a bit of luck.
Thanks Keith for this comprehensive article on precious metals. This one may be an instant classic. Much appreciated! But I note in the charts that for several weeks at a time, the market price of gold and silver can diverge radically from the ‘real price’, even in general direction. And it looks like the direction of ‘real price’ for gold is an important indicator. But silver is really all over the place, perhaps reflecting the smaller and very emotional silver market. But these charts are really helpful for us to understand your weekend updates. Would you please post the updated charts with each weekend updates??
Thank you very much for your work.
Hello Keith,
A very well-written piece, and I generally agree with you. Your thinking is clearly superior to Wall Street conventional wisdom. Keep up the good work!
I believe both monetary metals will increase in value relative to the U.S. dollar for the following reasons:
1) Relative value versus bonds, i.e. the worldwide bond markets are huge, many trillions of dollars. Bonds are becoming less and less attractive assets, lower yields and more potential risk to principal if market rates increase. A relatively small change in sentiment by Mr. Market, based on this fundamental, could cause a preference for gold and silver over bonds, at least for 5% to 10% of one’s portfolio. Because the bond markets are huge, a modest shift of sentiment could substantially increase the dollar value of monetary metals.
2) Demand from weak currency nations, i.e. if one is a citizen of Russia, Argentina, Turkey, Hungary, Brazil, Iran, etc., etc., then gold and silver is a time tested way to preserve purchasing power. India is a prime example of this fundamental. The U.S. dollar is clearly an alternative; yet both the dollar and monetary metals can benefit concurrently.
3) Market sentiment, i.e. the extended multi-year bear market in both metals has discouraged many potential buyers. This could reverse if a meaningful rally begins.
4) Some market participants incorrectly (in my opinion) regard gold and silver as commodities, not money; therefore they see commodities falling in value and assume gold and silver will do so also.
All assets must be assessed and valued relative to other assets. Bonds are expensive today. Prime real estate is expensive today. Stocks appear to be close to fully valued, which naturally means more risk as the margin of safety shrinks. Monetary metals look more attractive relative to these perceived more conventional assets.
Thanks again for your continuing good work.
Cheers,
Stew
Top notch Keith – thanks..
Thank you Kieth, very informative and interesting as usual.
Keith–
I studied your chart of silver market and fundamental prices, with special interest in the times when the fundamental price changed a lot. That’s when I noticed a discrepancy between your market price and the “spot price” from Stockcharts.com ($silver). You show a big drop from $22 to less than $20 in late February, 2014. There is no similar drop in the daily chart at Stockcharts.com. Is there an explanation?
Keith,
I have always admired the intellectual content of your posts but this is the first time I have been able to congratulate you on the clarity of your prose. To write clearly about a complicated subject is very difficult and takes a great deal of time, re-reading & re-writing. Thank you for putting in that extra effort.
“Three is just magical thinking. For example the bigger your position, the more you control the price. How? Of course markets don’t work that way.”
So far I have only read up to that point. It immediately brought something to my mind.
I may be mistaken about this, but didn’t the Hunt Brothers get a visit from the U.S. Government concerning their Silver position? It was at that time(the very early 80’s) that Silver went to $50. The market share that the Hunt Brothers garnered had nothing to do with that?
From an article I’m reading on this… http://www.investopedia.com/articles/optioninvestor/09/silver-thursday-hunt-brothers.asp
“The Squeeze
The Hunt brothers had already considerably reduced the amount of silver available on the market and made their continuing buying action all the more powerful by pushing up the price of silver. In any commodities deal, there are longs and shorts, but in this case, the shorts were vastly overmatched. A short squeeze formed as the brothers continued to buy up available silver stocks and take delivery on their futures contracts. The Hunts’ position was now worth around $4.5 billion. People were pawning coins and silverware to take advantage of the high price of silver, but there was less than a third of the silver market left that the Hunts did not control via futures.
Uncle Sam Steps In
The U.S. government became concerned over what it saw as a clear attempt at manipulating the nation’s silver reserves, and the fact that this corner involved the Middle East added some venom to the government’s reaction: after all, the 1970s oil crisis was still fresh in the nation’s mind. Federal commodities regulators introduced special rules to prevent any more long position contracts from being written or sold for silver futures. This stopped the Hunts from increasing their positions by temporarily suspending the fundamental rules of the commodities market. With longs frozen and shorts free to pile in, the price of silver began to slide. Margin calls on the loans began to take a toll on the Hunts’ reserves to the point where they were paying millions a day in calls, storage fees and interest.”
I would imagine that you are already well aware of all this and will have an explanation. I look forward to hearing it.
Thank you Keith