
Monetary Metals Outlook 2018
Prefer to read offline? Download Outlook 2018.
Predicting the likely path of the prices of the metals in the near term is easy. Just look at the fundamentals. We have invested many man-years in developing the theory, model, and software to calculate it. Every week we publish charts and our calculated fundamental prices.
However, predicting the outlook for a longer period of time is much harder. The fundamental shows the relative pressures in the spot and futures markets, but they only show a snapshot. They do not predict how those pressures might change. For that, one looks at the dollar of course, credit, interest rates, other currencies, the economy, and even wild cards like bitcoin.
In fourth grade math class, Miss Jennifer didn’t want the kids to just write “42” (with due respect to Douglas Adams). She wants to see the work all written out. It’s not so valuable if we say “silver to $10” or “silver to $100”, without saying why.
Below, we will show our “long division” work before getting to our bottom line numbers. But first…
Review of Last Year’s Call
We did not publish an Outlook 2017, because we were in the midst of developing and launching not just our website, but the engine that powers it, our data science platform. We will look at much of this data in this Outlook 2018.
To keep ourselves honest, we like to review our call from the prior year. Without a 2017 call, we will briefly look at what we said in Outlook 2016:
We think that buying gold now is likely to turn out to be a good deal. We do not promise that the price can’t stay low (obviously, if it can be low now it can remain low or even go lower). We simply see value here.
To those looking to trade, you might buy gold for a trade.
In silver, we’re in a much better situation than last year when silver was overpriced. The price has come down. It’s now close to the fundamental, plus or minus. However, there just isn’t a strong case for buying it now. There is no case for buying silver for a trade. It’s just a roll of the dice.
…
The gold to silver ratio closed the year around 76.7. Our model suggests it could be headed over 85.
That did not turn out to be a bad call. Gold ended 2015 around $1060. By the middle of the year, its price had shot up to about $1370. This was an overshoot of its fundamentals (which we called in that year’s July 3 Supply and Demand Report). We said market price was $200 over fundamental price. By the end of the year, the market price was $1150. Our call at the start of the year was right, and so was our call at the mid-year spike.
Silver ended 2015 just under $14, and spiked over $21 in 2016—a 50% gain. In our July 3 Report, we said it was $3 over its fundamental price. That is a call for a big drop. The market obliged us, with the price coming down to Earth.
By year’s end, it was under $16. +$2. Not a bad dice roll in our Outlook 2016.
The gold-silver ratio rose to a high over 83 in early 2016 (and again in 2017), also per our call.
At the time of our July calls, the rising price had spun many analysts into a frenzy. We noted headlines at the time, about the “goldwagon to $10,000” and “$360 silver”. That was the backdrop for our calls for falling prices of the metals. We are comfortable being contrarian not just to the mainstream, but to the gold community as well. We are interested in the science of economics, not popularity. And if necessary, we will place our bets on “DO NOT PASS”, which is widely considered antisocial behavior.
How Not to Think about Gold
It may seem odd to begin by discussing how not to do it. However, these approaches are very common and many of our readers start with this perspective.
There are several popular approaches to analyzing gold. If you visit some alternative investing or gold sites, you will find conspiracy theories about price manipulation, rumors, out-of-context-factoids, and finally mining production and manufacturing consumption.
We have lost track of the number of prominent people who have published a hard date at which a vague event of monumental importance was to occur. These dates have all come and gone. These guys have predicted dozens of the last zero hyperinflations. The dollar is still intact.
Our view is that the dollar is indeed dying, but it is not via the instant white hot supernova of hyperinflation. It is by a long drawn-out asphyxiation, the drowning of a competent swimmer out at sea. It is not going to die when “the sheeple wake up,” or due to some meeting of the G20, or a declaration of the IMF that the dollar’s reserve status is gone. That is not how it works.
These approaches are unhelpful. They can confuse long-term holders, and cause traders to make costly mistakes.
We have written a lot to debunk claims of price manipulation (here is our recent open letter to Ted Butler, with graphs of our data going back to 1996). There are many others on our site.
Broadly, conspiracy theories fall into a few categories. One, central banks are selling gold. Maybe, but what explains the even-larger price drop in silver? The banks don’t have any silver. Two, banks are short-selling futures naked. This would cause backwardation. It would also cause expiring contracts to move in the opposite direction than they actually do. Three is just what we have to call magical thinking. For example the bigger a trader’s position, the more he controls the price. How’s that supposed to work?
We would put rumors, Indian gold import numbers, and news into the same bucket. Even when factual, these items are the investing world’s equivalent of an attractive nuisance—they can lure you to financial harm. Most importantly, one should never trade based on what the Fed has done (increase the quantity of dollars) or will do (increase it even more). That is not what drives the gold price. We would think this is obvious now, after years of the quantity of dollars increasing but the gold price falling.
Finally, there is electronics and jewelry consumption, and mine production. We firmly insist that gold and silver cannot be understood by looking at small changes in production or consumption. The monetary metals cannot be understood by conventional commodity analysis.
This is because virtually all of the gold ever mined in human history is still in human hands (to a lesser extent for silver). No other commodity comes even remotely close. The World Gold Council estimates the total gold stocks at 188,538 metric tons at the end of 2017. We believe this understates the reality, perhaps by a large multiple. People have been hiding gold from their governments and tax collectors for thousands of years. Gold has always been the sort of thing that most people would rather keep quiet about. It defies any systematic inventorying process.
In any case, annual production is a tiny fraction of even this conservative number. World Gold Council reported mine production has averaged 3,247 tonnes over the past three years. This is just 1.7% of then-existing stocks. In other words, it would take 58 years at current production levels just to produce the same amount of gold as is now stockpiled. In regular commodities, this same ratio—stocks to flows—is measured in months. We just don’t hoard wheat and oil for the long term, for obvious reasons. Nor even iron or lumber or other durable materials.
If total gold mining is 1.7% of gold inventories, then small changes within that 1.7% are not likely to have much impact on the gold price.
How We Think About Gold
The implications of this are extraordinary.
All of that stockpiled gold represents potential supply, under the right market conditions and at the right price. Conversely—unlike ordinary commodities—virtually everyone on the planet represents potential demand. If someone offered to pay you 1,000 barrels of oil, where would you put it? The same value of gold could fit in your pocket.
A change in the desire to hoard or dishoard gold, even a small one, can have a big impact on price.
There is no such thing as a glut in gold. Through rising and falling prices over thousands of years, the market goes on absorbing whatever the miners put out. Gold mining does not collapse the gold price, as oil drilling or copper mining does, when inventories accumulate. The whole point of gold is that inventories have been accumulating at least since the time of the ancient Egyptian Empire.
Why would people be willing—not just today, in the wake of the great financial crisis of 2008 and unconventional central bank response, but for thousands of years—go on accumulating gold and silver?
There is only one conceivable answer. It’s because these metals are money. Compare gold to oil. The marginal utility of oil—the value one places on the next barrel compared to the previous—declines rapidly. For oil, it falls rapidly because once your tank is full, you have that storage problem—assuming you even directly use oil at all.
People are happy to get the 1,001st ounce, and accept it on the same terms as the 1,000th or the 1st ounce. It doesn’t hurt that you could carry those 1000 ounces in a backpack, nor that you can find a ready market for it anywhere in the world, from London to Lisbon to Lagos to LA to Lima to Laos.
So if gold is money, then what’s the dollar? The dollar is a small slice of the US government’s debt. It is a promise to pay, though it comes with a disclaimer that says the promise will never be honored. The dollar is credit, whose quality is falling. What does that mean for our discussion of the gold price?
It turns it inside out.
We don’t look at it as a gold price of $1,350. Instead, we firmly insist that it’s a dollar price of 23 milligrams of gold. This is not merely semantics. It is a paradigm shift—easy to say, but harder to get your head around. The advantage of this perspective is that you can see the market much more clearly.
If you are in a rowboat, tossing about in stormy seas, would you say the lighthouse is going up and down? If you have a stretchy rubber band, would you use it to measure a steel meter stick? Can you say that the steel is getting shorter, as the elastic stretches? No, the lighthouse and steel are stable but the waves and rubber band are not.
When you say “gold is going up”, you can’t help but think you are making a profit. But if you say “the dollar is dropping” then you realize the truth. Sure the gold owner may have more dollars, but those dollars are worth less than they were. He should not be so tempted to spend down his gold savings, merely because the value of the dollar fell.
You cannot profit merely by holding gold. You can avoid losses (which is a good thing, of course). We go further. We advocate that everyone calculates his net worth in gold, and measure profit or loss based on gains or losses in gold ounces. If you had 100oz and later you have 110oz, then you got richer. If you went down to 99oz—even if the price of gold is higher, and your gold is worth more dollars—you have suffered a loss. Even if you are not a hundred percent convinced, consider this easy exercise. Just divide your dollar net worth amount by the then-current price of gold. It’s a good discipline to get into.
You can profit from holding silver, when silver goes up. We don’t mean its price in dollars, but in gold. For example, if the silver price begins at 400mg gold and it rises to 600mg, then you have made a profit of 200mg or 50%. It is about 400mg right now, and it was last at 600mg in 2012 (silver was 400mg gold when we last published our Outlook in 2016).
You can sometimes profit by going long the dollar. It is declining in a century-long downtrend, but that doesn’t mean there aren’t corrections along the way. For example, the dollar hit a low of 16mg gold in 2011. After that, its rally was impressive. It current value is up from that low by 44%.
At other times, you can profit by shorting the dollar with leverage, for example buying gold futures on margin. Suppose you have 100oz gold, or about $135,000 today. You need $3,850 in margin per contract to open a position. Your stake lets you buy 35 contracts, each representing 100oz. If the price of gold goes up by 3%, then you profit by $40.50 X 100 X 35 = $141,750. This is enough to buy 105 ounces. Not a bad profit, if you started with 100. Of course, the risk is extreme if you use leverage like this (as they say on those shows on TV when they blow up stuff with dynamite, “don’t try this at home”).
How We Analyze the Gold Market
We think of the market as the coming together of 5 different primary groups.
- Buyers of metal. These are typically hoarders. Unlike buyers of other commodities, they don’t have to incorporate it into a product and sell it to make a profit (jewelry manufacturers being a very small part of the market, as discussed above). So there is no particular price that is necessarily too high, other than whatever their notion of a fair price is at any given moment. It’s worth noting that jewelry manufacturers are mere intermediaries, buying gold to put into product that is typically held owned for a long time by the buyer. And often held as money.
- Sellers of metal. They are dishoarding, for whatever reason. They may think the price has hit a high enough level to attract their greed, or a low enough level to activate their fear. Miners are a subcategory of sellers, though miners are price takers.
- Buyers of paper (e.g. futures). These are speculators, with three key differences from buyers of metal. One, they use leverage. Two (for that reason and others) they have a short time horizon. Three, their exclusive goal is to make a trade for dollar gains.
- Short sellers of paper. Not nearly so big a group as popularly imagined, there are people who take the two lopsided risks of (1) shorting something with limited profit and unlimited loss potential and (2) fighting a 100-year trend. These people are nimble and aggressive and certainly play for the short term.
- Warehousemen, aka market makers. If few people are willing to bet on a rising dollar (i.e. falling gold price), then who sells gold futures? Aren’t futures a zero-sum game, with a short for every long? Enter, the warehouseman. He stands ready to carry gold for anyone who wants future delivery. If you buy a future, you are signaling that you want gold, not to be delivered now, but at some date in the future. For a profit, this group will sell it to you. How do they do that? They buy metal in the spot market and simultaneously sell a contract for future delivery. They don’t care at all about price, as they have no exposure to price. They respond to spread. Suppose they could buy gold in the spot market for $1,350 and sell it for Dec delivery for $1,362. That is 0.9% for six months, or 1.8% on an annualized basis. That is not so attractive at the moment, with the Fed in one of its little rate-hiking fits (more on interest rates below).
It’s important to keep in mind that virtually all of the gold ever mined is in someone’s hoard. There is no such thing as a glut or shortage. However, the market can experience relative abundance and scarcity and the spreads of the warehouseman provide a good signal to see it.
If there is a big basis spread, that means two things. One, speculators are bidding up futures contracts. And two, the marginal use of gold is to go into the warehouse. This is a sign of abundance.
Normally, the price in the futures market is higher than the price in the spot market. This is called contango. Contango means it is profitable to carry the metal, which is to buy a metal bar and sell a future against it. However, the spread can invert and it has many times since the crisis of 2008. When it is inverted—called backwardation—it is profitable to sell metal and buy a future. Such decarrying is, by conventional standards, risk free (it’s not, see below). It should never happen in gold, as it is a sign of shortage and there is no such thing as a shortage in a metal which has been hoarded since ancient times. Backwardation is a signal to the warehouseman to empty out the warehouse.
In backwardation, the marginal supply of metal is coming from the warehouse (carry trades are unwinding). Obviously, there is only a finite supply of gold held in carry.
This is the only way to analyze supply and demand fundamentals for the monetary metals. They are not consumed. They have a stocks to flows (i.e. inventory divided by annual mine output) ratio measured in decades. As they’re not bought to consume, nor to incorporate into a product that has to be sold to meet a price point, there is no particular price ceiling.
The five market participants interact to form a constantly changing dynamic. It is this dynamic that we study when we look at spreads between spot and futures, and changes to these spreads. Monetary Metals has developed a proprietary model based on this theory, which outputs the Fundamental Price for each metal. This is updated as the market changes every day.
We have published more on the theory.
Macroeconomic Conditions
It is now common belief that we are in for a period of rising interest rates. We don’t agree.
In his theory of interest and prices, Keith Weiner describes the falling interest rate environment that began in 1981 when interest rates were above the productivity of the marginal entrepreneur. With each downtick in the rate, the incentive to borrow more becomes greater. At the same time, the net present value of each dollar of that debt is doubling with every halving of the interest rate.
Interestingly, we saw a recent research report on the debt of zombie corporations. A zombie is a company whose profits are less than its interest expense. In other words, it survives only by grace of ultra-low rates and ultra-loose credit markets. According to this report, about 10% of the corporations listed on European stock exchanges are zombies.
We don’t know if we believe that (and we are not going to cite the report), but even if the number is a fraction of that it illustrates this point about interest being above productivity for marginal firms. And if it’s anywhere near 10%, the margin is no thin line for a few outcast losers. 10% of public firms. Plus who knows how many privately-held firms.
So what happens if the Fed tries to raise rates? Obviously, the zombies will collapse. Their employees will be laid off, putting them under pressure to default on their own creditors. And reducing their spending on everything from pizza to petrol. Which reduces revenues to firms which are not currently counted as zombies.
Rising rates is also the inverse of falling asset prices starting with—by definition—the bond. The so called wealth effect is put into reverse. If people spend more as they keep making capital gains (not to mention profitable trades), what happens when their portfolios shrink? They buy less, if not pizza, then Porsches and pinot noir.
If falling rates incentivize companies to borrow to buy their own shares, and in some cases to pay dividends, what happens when rates rise?
When the economy is in this state, credit demand is generated with each downtick of the interest rate. Profit margins are soft, but if the cost of borrowing goes down then there may be a business case to open that next store, to develop that next strip mall, etc. If the cost of borrowing goes up, then it’s batten the hatches.
In 2014, before this rate hiking episode began, 6-month LIBOR was 0.32% (less than 33 basis points). Since then it has risen to 1.96%. This is big increase in cost for business borrowers (to say nothing of governments). For every $1,000,000 financed, the annual cost of interest was $3,200 a year. Now it is $19,600.
Automakers in the US are still offering 0% for 72 months as an incentive to sell cars. Rising rates gives them a bitter choice: either eat the additional costs or else pass the cost on to consumers and sell fewer cars. So far, they are eating the cost. Perhaps they need to sell those cars to generate the revenues to pay the interest expense on the debt they incurred to expand the capacity of their factories. A decision they made when LIBOR was 0.32%.
The Federal Reserve does not have control over the interest rate on the long bond the way it has over the short end. This has particularly poignancy to the banks. The banks borrow short to lend long. They are profiting from the spread between LIBOR and 10-year Treasurys.
At the time that LIBOR was 0.32%, the 10-year Treasury was 2.2%. Banks could rake almost 2% from this trade. Today, the Treasury yields 2.7%. It’s up, but not nearly so much as LIBOR. Banks can only make 0.7% on the same trade.
And another spread has been crushed. Here is a graph of the spread between high yield bonds and Treasurys.
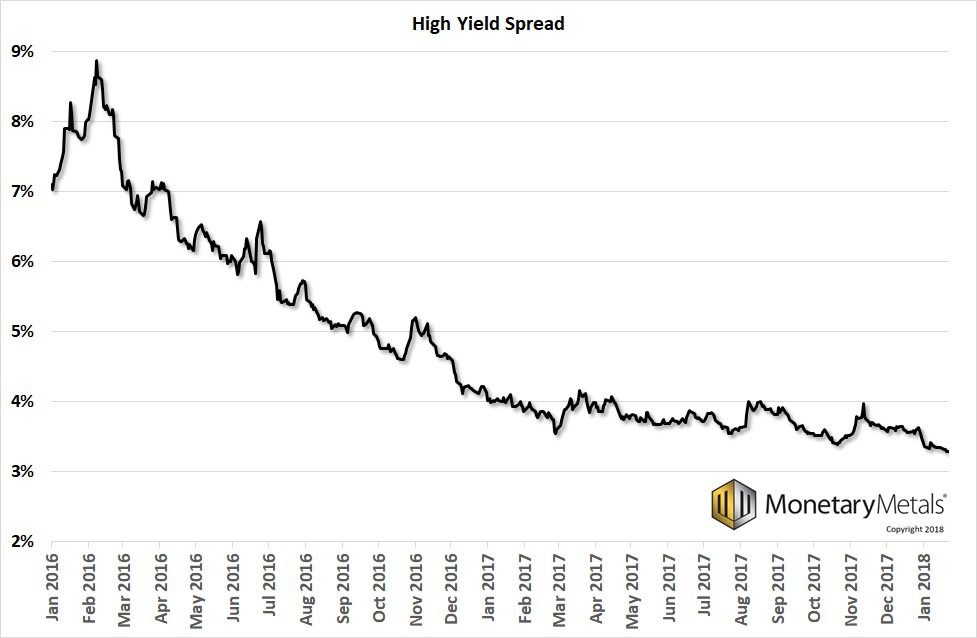
It is now at an all-time low. In our Outlook 2016 (this graph begins Jan 1, 2016) we saw the rising trend and said there may be a problem brewing. Well that was short-lived. Somehow, somewhere a central bank turned on the right spigot to tamp this down (and that could be the same spigot that pumped up zombies to 10%).
Let it sink in. You get barely more than a 3% premium to hold high yield bonds (i.e. below investment grade, i.e. “junk”) instead of Treasurys. And now we are to believe that rates will continue to rise. These companies are already a high risk of default, and we are going to increase their cost of borrowing and compress their margins even more?
Something has to give. Or several somethings. We believe one thing that gives will be interest rates. They cannot rise very far, or durably.
Another thing that could give is the long-in-the-tooth bull market in stocks. And while we’re at it, real estate—certainly retail space, if not residential.
We want to be clear that a falling interest rate is enormously destructive. We are not proposing a monetary policy of cutting rates. We are simply saying that the Fed is boxed into a corner by its own past bad policies. We don’t think it wants to repeat of 2008, if it has a way to postpone the reckoning. Even if the very postponement makes the inevitable reckoning worse in the end.
Falling rates creates massive capital gains for bond holders, and the rising bond price is propagated to other markets. These gains are not from rising productivity. They are from monetary policy, which cannot create wealth but merely redistribute it. These gains come at the expense of bond issuers, who are, in essence, short their own bonds. If you short something and it goes up, you incur losses (we acknowledge that this is not recognized in current accounting practice).
We will talk about rising vs. falling interest rates and its impact on the price of gold below.
Not the Drivers of the Big Price Move
Speculators view gold and especially silver as just a vehicle to ride, to make more dollars. They can pull the price pretty far, at least for a while. Like stretching a big rubber band however, it gets exhausting to keep up the force. Eventually if they’ve gotten the trend wrong, they must let go. At some point, fatigue sets in (not to mention the cost of the keeping and rolling a futures position). Here is a graph of the cost of rolling a futures contract, showing five years.
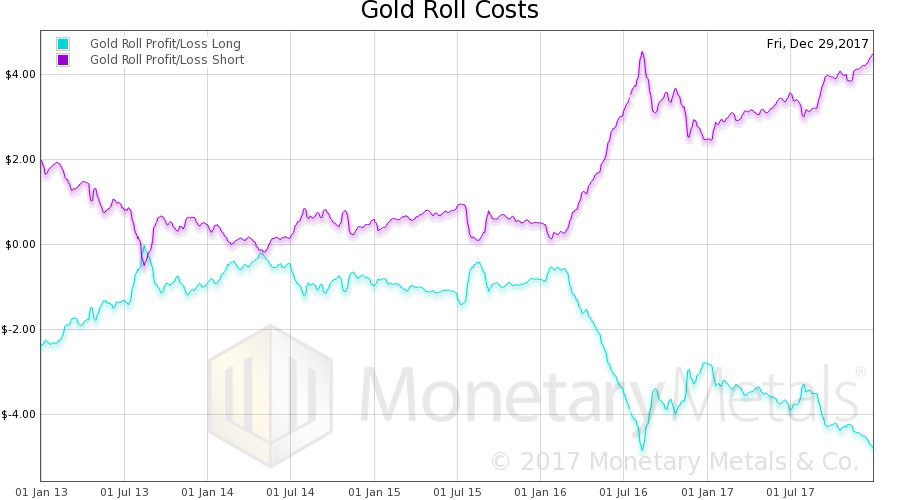
For long positions, look at the cyan line which is negative. For quite a while, it cost almost nothing to roll each futures contract, around 50 cents. But starting about two years ago, the cost went up. It is now about 10 times greater. A speculator had better expect a big price move to pay that for each contract roll (six time a year).
If you want a durable move, it will not be driven by people who spend $30 a year per ounce to hold their betting position.
Next on to inflation, so called.
We said it in the Outlook reports two years ago, and we reiterate now: we would not put capital in harm’s way betting on the thesis that inflation is going to jump up, and that this will cause the gold price to jump up.
For one thing, some commodities like wheat continue to fall. What kind of inflation is that? Or for that matter, car manufacturers offering 0% for 6 years?
One thing needs to be said about rising consumer prices, which most people call inflation. Prices are driven by monetary factors. Keith shows in his theory of interest and prices that a falling interest rate tends to push commodity prices down, and a rising interest rate tends to push prices up.
However, prices are also driven by nonmonetary forces. Some examples that push prices up include: tariffs (such as Trump’s tariffs on washing machines and solar panels), licenses, permits, zoning, minimum wage hikes, local ordinances requiring all loading to be done between 2am and 3am (with mandatory triple time for workers, of course), environmental regulations, and compliance.
Prices go down due to efficiency improvements, and of course due to good ol’ fashioned competition from Korean-made washing machines.
It is unscientific to lump together two different causes into one concept, and use that concept as if it referred only to one of them. Unfortunately, eminent economist Milton Friedman declared that “inflation is everywhere and always a monetary phenomenon.” This false truism encourages fuzzy thinking.
So back to the question, if mandated Americans with Disabilities Act bathrooms reduce the floor area that restaurants can use to generate revenue, this may put a few restaurants out of business and the rest can raise their prices to serve a smaller market willing to pay more for food.
If zoning restricts the number of gas stations, environmental impact studies add $500,000 to the cost of building one, local labor law requires at least three employees on duty at all hours, and the sign ordinance restricts the size of the sign so it attracts fewer travelers on the highway, then the price of gasoline is pushed up. If California mandates a screwy blend of gas and alcohol, that can drive up prices further in California (and Arizona, a much smaller market, often pipes in the California blend).
Or suppose they pass a law that gives deadbeat tenants a laundry list of rights. Such as the right not to be evicted, while not paying rent. And the right to sue the landlord for not providing heat—after the tenant sabotaged the heating unit. The right to sue for discrimination if a landlord did not choose to rent to someone for some reason. Then fewer people are willing to be landlords. The result is fewer available units for rent, and hence higher prices.
These are not monetary phenomena. They are not caused by the Fed.
They also have nothing to do with the price of gold. There is no reason to expect the price of gold to go up every time a local regulator increases the cost of providing any goods that are included in the consumer price index. And there is no reason to expect anything in particular to happen to the price of gold, either.
Be Careful What You Wish For
Many gold speculators would love the gold price to rise rapidly to $5,000 or more. We would first like to point out that this means the dollar drops from 23mg to around 8mg. The whole world runs on dollars. Think what will be happening to people, pension funds, insurance, banks, farmers, employers, etc. if the dollar drops almost 75% in a rapid spike down.
It is tempting to look around, see the fat cats driving their Ferraris, or else being driven by their chauffeurs, to bars on the roofs of skyscrapers, jetting around the world, wearing Swiss watches and Italian suits, and think “I’d like to be there.” The fantasy is, “If only gold goes to $5,000 or $10,000, then that will be me.”
We don’t think so. If the price action happens slowly, say over 10 years, it will represent a steady erosion of the dollar and of the world’s capital base. Holding gold will keep you (mostly) safe from that erosion, but will not make you rich.
If it happens rapidly, it will be something else entirely. The collapse of 2008 was ugly, until central banks put it on pause. They agreed to an unfathomable Faustian deal with the devil. When the collapse resumes, it will make 2008 look like a dress rehearsal.
Those rooftop bars will be closed. There will be Ferraris for sale cheap, but with refineries and gas stations failing, getting fuel could be a challenge. Moving dollars out of your bank account to buy the fuel could also be a problem. The mood on the street will be ugly, and one may be better off not flaunting a Ferrari openly. Even today, in the relative calm of the current boom, many municipalities are having a hard time keeping up vital services such as police and fire. They will find it much harder when they can’t keep on borrowing.
Something will inevitably happen to remind people that gold is not just for hedging inflation or speculating for dollar gains. To understand, put yourself in the position of a citizen of Cyprus in February 2013. On one Friday afternoon, you had what you thought was a few hundred thousand euros deposited in a bank.
And then, on Monday morning, you didn’t.
It turned out that the Cypriot banks had invested in Greek government bonds. They had long since lost your deposit but continued to operate in a state of insolvency. As deposits drained away, they got to the point when they could no longer keep up the pretense. People who had their euros locked up in closed banks nervously waited. There were tight limits to withdrawals. And haircuts for depositors—losses shared with other classes of creditors. Virtually everyone on the island was in this vulnerable and terrifying position.
Those few Cypriots who had previously bought gold, found they could easily get on a ship and go to the mainland where conditions were normal. We spoke with a gold bullion dealer in Nicosia, Cyprus. Very few had bought gold. Most did not realize their peril (or did not want to see it).
The virtue of owning gold, for Cypriots, was not in the hope its price would rise. It was more elemental than that. Gold is not someone else’s liability. It is a lump of metal, which means that it cannot default. It is not subject to a negotiation of the International Monetary Fund, the European Central Bank, and the European Commission. Unlike the so called Troika, gold will not sell you up the river.
If you own it on Friday, you still own it on Monday and it gives you the freedom to do as you please.
Events are coming that will remind people of this. We think these reminders are likely to be very pointed. When hundreds of millions of people in Europe, South America, and even North America eventually, wake up one day to the reality of losses on what they had assumed was money safely in the bank, the buying pressure in gold and silver will be truly ferocious. Notably, the selling will not be comparable. There will be some fools who are eager to book their illusory profits as the price rises. But most won’t trade their metal for bank deposits of unknown provenance and unknowable risks.
We will come to a time of exponentially rising price combined with exponentially rising backwardation. That is, the gold futures market will cease to work.
It will be a time of woe, though a bit less horrible for those who own gold compared to everyone else. Not a time of 108th floor bars, $50 cocktails, and jetting off to London for the weekend.
We emphasize that the endgame of the dollar is not imminent. We will continue to update the picture as events inexorably play out.
In 2015, we published an article about the coming collapse of the Swiss franc. We were early (though we did not say the collapse was necessarily coming in 2015). This collapse, when it comes, will shake up the monetary system. The yield on Swiss bonds is now negative out to the 9-year bond (this is an improvement).
Our Numbers
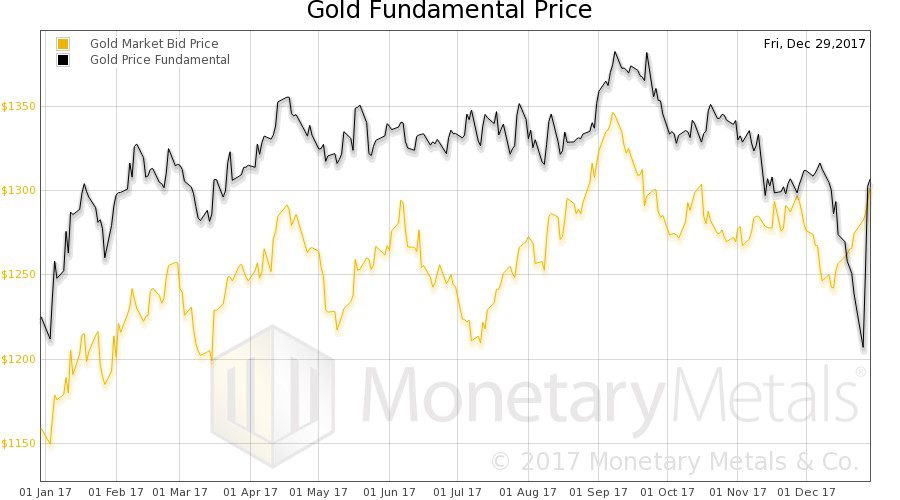
Gold closed the year 2017 at $1,303. The Monetary Metals Fundamental Price was just about the same as the market price.
Here is a graph of the market price overlaid with the Monetary Metals Fundamental Price.
Silver closed at $16.90. The Monetary Metals Fundamental Price closed the same. Here is a graph of the market price overlaid with the Monetary Metals Fundamental Price.
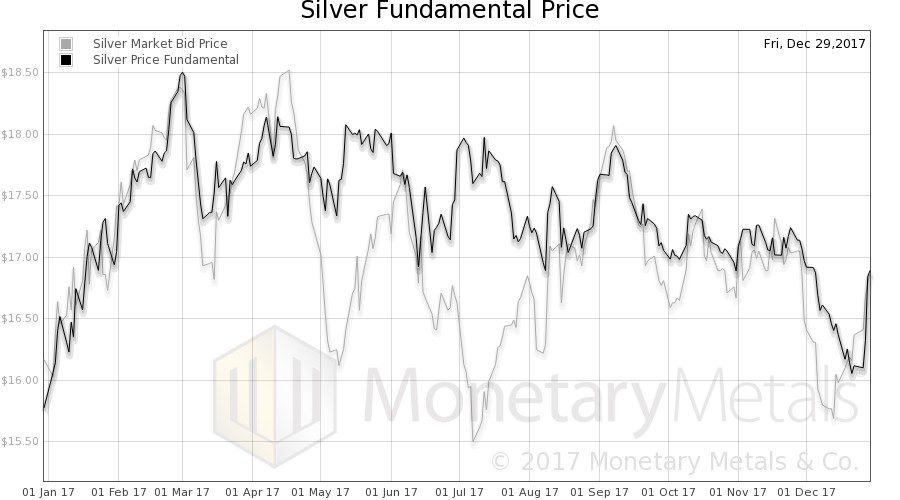
In both metals, the fundamental price rose, moving through the year with less volatility than the market price.
This year is interesting, as the fundamental prices ended at the same level as the market prices for both metals. Whatever predictions we may make, cannot be made based on the fundamentals.
Fundamentals can and do change. So what do we expect this year?
How Not to Predict the Gold Price
In the Outlook 2016, we addressed the belief that the money supply (i.e. quantity of dollars) drives the price of gold. Short answer: it doesn’t.
Some say that rising interest rates will cause rising gold prices. Instead of arguing, let’s look at some charts. Here’s a chart showing the 10-year Treasury yield against the price of gold, going back before Nixon’s infamous gold default in 1971.
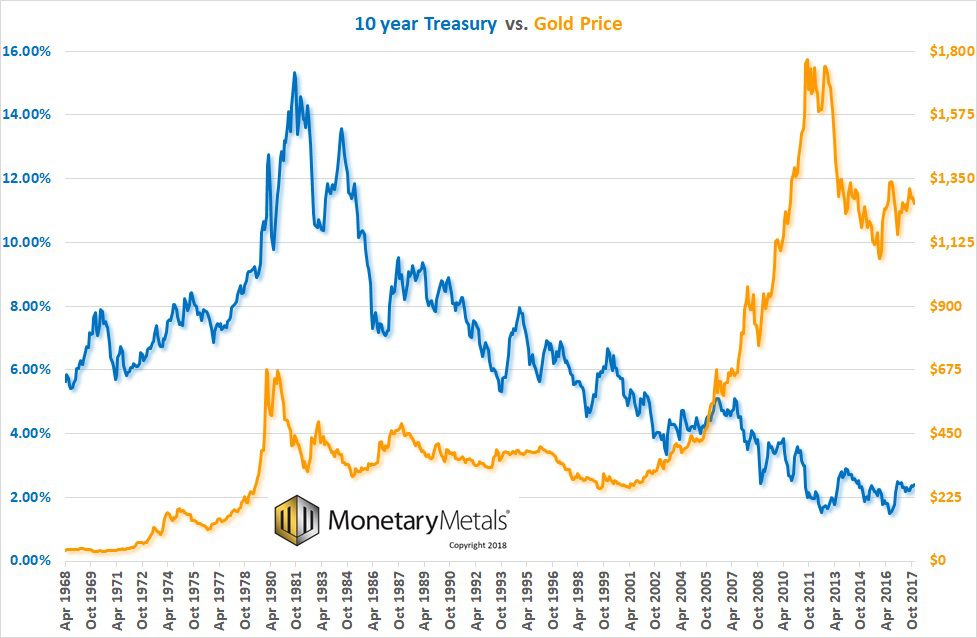
You can see periods were the interest rate is rising and the price of gold is rising, through around 1981 (when the interest rate hit an extreme and dysfunctional peak). But there are also periods where the opposite trend occurs. From 2007 through 2011, we have a rising gold price and falling interest rates. And then there’s that inconvenient period in the middle, twenty years from around 1981 to 2002, where the gold price went sideways while the interest rate was falling.
The interest rate is not even correlated with the gold price, much less causal. Yet hope springs eternal for this hypothesis.
One criticism is that this graph shows nominal rates, and real interest rates are the real driver of gold.
Before we get to the graph, we must offer a sardonic comment about this. The above graph shows the actual rate at which actual lending actually occurs. People actually put up their cash and actually get paid this rate.
But this rate is called “nominal” by the Monetarists, who dismiss it in favor of a so called “real” rate.
To understand this idea, one must understand inflation. Even the proponents of the consumer price index cannot agree on how to define or measure it, much less the true inflation number. But they somehow hash out a compromise, and define a basket of goods such as apples, oranges, gasoline, and rent. This basket is measured to compute the consumer price index.
Anyways, we are supposed to subtract from the rate of interest at which lending occurs. This gives us a rate of interest that is dubbed “real.”
Except this real number does not exist, no lending occurs at it, and it is computed based on highly contentious inputs (and there’s that bit about adding apples and oranges, which Miss Jennifer taught us not to do).
The above graph shows only the nominal rate at which trillions are borrowed and lent. But let’s look at a graph of real rates against gold.
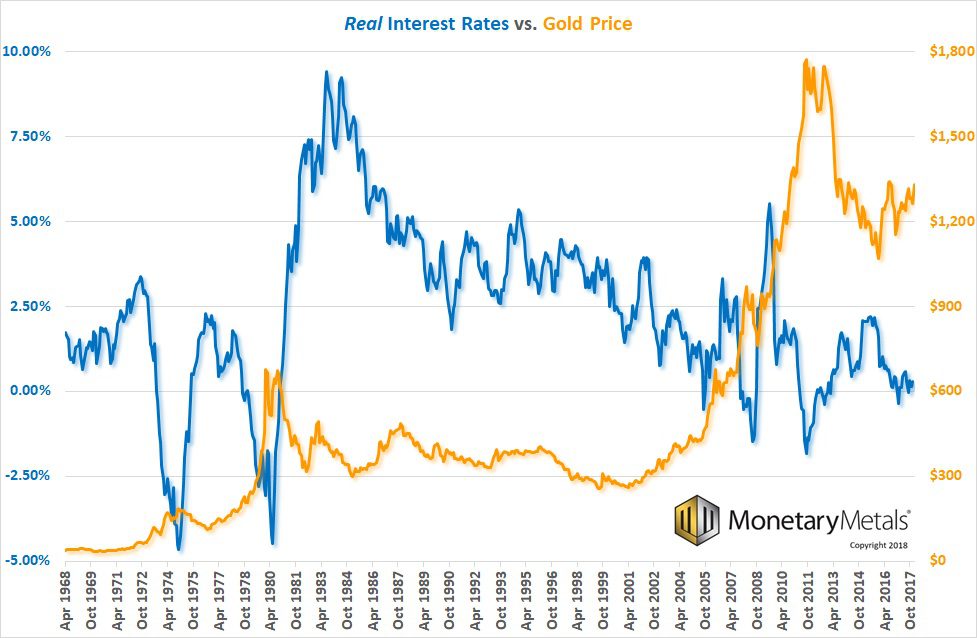
It does not look too well correlated. In fact, the correlation is -0.23. That’s not much above random.
Some folks in the gold community prefer Treasury Inflation Protected Securities. TIPS is a 10-year Treasury bond, with one difference. The principal amount is adjusted based on the consumer price index. So let’s plot this against gold.

We want to first note that the St Louis Fed economic data site Fred (from which we are getting all data on interest rates and inflation) does not have TIPS data going back prior to 2003. It’s OK, even in this much-shorter period we have enough data to see what we need to see.
Forget causality, there is obviously not even correlation.
In zone I, real interest is sideways from January 2003 through April 2006. Yet the price of gold rose 74% from $344 to $597. In zone II, interest rose by 17% from 2.4% to 2.8%, while the price of gold rose another fifty bucks.
But in zone III, interest collapses by two thirds, while the price of gold goes up another 50% to $949. In IV, we have interest spiking up and gold price falling down. In V, we repeat the falling interest and rising gold price trend.
In zone VI, we have quite a big drop in gold price with interest pinned at zero. And in VII, interest goes nowhere while gold price drops.
Did we cover all combinations? So called real interest rates can move with or against the price of gold. Or either might not move while the other moves in either way.
They aren’t connected. They just aren’t.
That said, there is a connection between interest and gold. It’s just not a simple correlation. We will address that below.
First, we want to comment on two things that have many buzzing today. One is: the dollar is falling. They won’t measure the dollar in terms of gold, but they measure it in terms of euro, pound, yuan, etc.
But these currencies are dollar-derivatives! When they go up, it does not indicate the dollar is going down. It indicates that the risk-on trade is back on. It indicates a boom (or mini boomlet), where the market is borrowing dollars to exchange for other currencies to buy another asset. This can either be to profit from a higher interest rate, or in the hopes of capital gains. Right now, oil is up 50% in the last 7 months, copper is up, and we assume producers both domestic and foreign are up. And other assets. And currencies of countries which produce oil and copper. And many other assets rise in a general boom.
You cannot infer that because the euro is on a tear, that this means the dollar is going down and therefore gold will go up.
The other is bitcoin and other cryptocurrencies. It is often argued that the buying of bitcoin will somehow displace or lure people away from gold. We don’t believe so, for a simple reason. By now, those who bought gold expecting its price to go up thousands of dollars have long since sold. There are traders, of course, buying (and selling) to profit on each price move. But the belief that there is a huge skyrocket-move coming soon must surely have been beaten out of everyone’s heads by now.
Gold does not compete with bitcoin to be the asset of choice for betting on such moves.
Witness that the price of gold has risen well over a hundred bucks over a month and a half. This is definitely not being driven by retail. Moribund conditions currently prevail in the retail coin and bar market. If you have recently bought or sold, you may have noticed record low premia for every precious metals product. Here is a graph from our friends at Goldchartsrus showing the premium charged by one large dealer for silver Eagles (we removed the price graph to focus on just the premium). If you have sold silver Eagles to a dealer, you know that the price they pay you (their bid) is considerably lower.
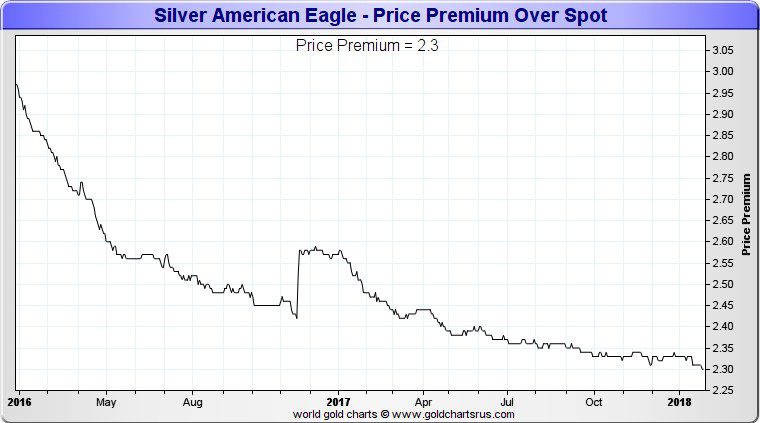
The price of silver has risen +$1.69 in a month and a half, and retail has not been participating. The chart shows that the premium collapse for silver Eagles has been ongoing for at least two years (from other data on the site, we know that the trend begins in the second half of 2015).
This is why we believe that the fear of missing out of easy money to be made in bitcoin is not likely luring away many gold and silver owners. If anything, it might work the other way around. Bitcoin’s incredible gains, combined with volatility, may induce some bitcoin speculators to take some chips off the table. As they are often of an anti-Fed mindset, these chips may be gold rather than dollars.
What Drives the Gold Price
Excluding speculators, people buy and own gold for the long term because it is money. Nearly all of the gold ever mined in human history is still in human hands. So of course lots and lots of people own some. If we want to try to predict the price, we want to look at change at the margin. Will those who own now have a reason to sell? And will those who do not own it have a reason to buy?
The first question is: why does someone own money? Basically, he does not believe he is adequately compensated for the risk of being a creditor. Let’s first look at risk.
To own a paper dollar bill, one is a creditor of the Federal Reserve. If you think that the Fed’s paper is risk free (which it is defined to be by modern finance), then you have no reason to own gold. If you look at the Fed’s balance sheet, and wonder what happens as its cost of funding goes up and at the same time the yield of its portfolio remains flat and the value of assets is declining, then you see risk and hence have a reason to own gold.
To deposit that paper bill in a bank is to add bank credit risk on top of Fed credit risk. Once upon a time, the banks paid interest on deposits. But even now after some rate hikes, the banks are not in a position to offer much, as their margins are compressed.
An increased awareness of risks in the banking system causes people to buy gold, and hence the price rises.
Now let’s look at compensation to creditors, otherwise known as interest. Everyone has a price he demands, in order to give up his money and extend credit. If the interest rate offered to him is below this preference, he will not want to lend.
Central banks have a prime directive: to make it cheaper for the government (and its cronies) to borrow, so it can spend in excess of revenues. It seems such a simple exercise. Just buy government bonds. Push up the price of the bond, and that means the interest rate goes down (rate is a strict mathematical inverse of price). Unfortunately, they set in motion a dynamic system characterized by resonance and positive feedback.
To picture resonance, watch this video of the collapse of the Tacoma Narrows Bridge. The wind gusted at the resonant frequency of the bridge structure.
To picture positive feedback, watch this video of a guitar lesson on how to make that sound at the beginning of Foxy Lady by Jimi Hendrix (you have to hold the guitar up to the amplifier in just the right way).
The central bank may be able to push down the rate of interest, at least initially. However, they have no control over the time preference of savers. Normally interest is above time preference. But if they push interest below, then the violated savers will take action. Suffice to say that in this state, they prefer to hoard commodities rather than buy the bond offering interest that’s too low (read Keith’s theory of interest and prices for the full detail). If gold is legally permissible to be hoarded, then it’s the best good for hoarding. “Money is gold, and nothing else,” as JP Morgan said in 1913.
The last time interest was below time preference was in the 1970’s. And boy did the gold price rise during that decade. Not because the interest rate was rising per se, but because interest was below time preference. Alas, as interest rose, so did time preference. Like a ratchet.
We are looking at a spread—interest to time preference—and it cannot be measured directly, as there is no economic data series for marginal time preference or the marginal saver.
Notwithstanding the Fed’s present passive-aggressive toying with higher rates, we are still in the same falling trend ongoing since 1981. This means that each uptick in the interest rate may exceed some gold owner’s time preference (in bonds, if not bank accounts). To the extent that rates can keep rising, there will be a downward force on the gold price.
As an aside, Monetary Metals pays interest on gold, and we have clients who bought gold in order to earn interest. This would be a force driving people to buy gold, but we think it would be a bit premature to talk about our effect on the gold market just yet. Stay tuned…
If this were the only force pushing on the gold price, we would make a bearish call. However it is not. As discussed above, the rising rate itself increases the risk of default. Not of the Federal Reserve. Not yet. Its portfolio has a blended yield of around 2.5%. The Fed pays banks 1.5% to borrow to finance this portfolio, so it has a ways to go before its cash flow would become negative.
One prediction we are pretty confident in making—much more confidently than in 2016—is that junk bond yields will rise relative to Treasurys. In the first instance, this spread is at an all-time low, so there is little room for further compression and miles of room for a big move wider. Also, the rising rate in itself will push these junk issuers closer to default even if there were no other forces in the economy working against them.
We don’t believe holders of these high yield bonds are themselves likely owners of gold. However, capital losses on bonds, even junk bonds, will impact other balance sheets. We don’t know where they are tucked away in portfolios, but we would look to the usual suspects: pension funds, insurance, etc. Pension funds are already impaired. What will pensioners and older current workers do when they read that their pension fund is becoming more underfunded? Some may buy gold.
In addition to first world corporate borrowers, there is another group of borrowers who are in trouble. Everyone knows about Venezuela. Do they know about Sudan? Sudan is now entering what may be a hyperinflation. How many other third world countries will default on their obligations and blow out their currencies? Americans and Europeans may not be aware of Sudan (yet), but within that country and its neighbors, there may be some gold buying going on.
Falling credit quality, and especially widespread public awareness of falling credit quality, is a force that will push up the price of gold.
In 2008, the price of gold fell along with everything else. We believe there were likely two drivers. One, in a collapse like that, market participants need to raise liquid cash for margin calls, or even to pay notes on demand. They sell whatever they can, and with gold the bid-ask spread is always very tight so the losses are much less than with real estate or exotic financial instruments, which could have a spread of 25% or more. Here is a picture of the bid-ask spread in the spot gold market.
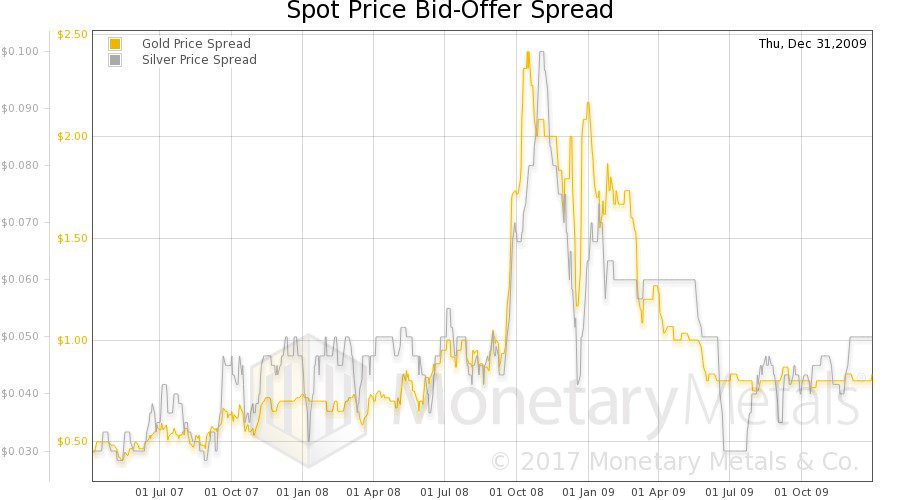
The bid-ask spread in gold widened during the crisis. But even at the worst part, the spread got only to $2.40. On an asset with an $850 price, that is still just 0.28% (not a typo, about one quarter of one percent). Gold is the most marketable commodity, defined by the narrowest bid-ask spread. By comparison, the spread in silver hit 10 cents, or 1% (four times wider than gold).
This time around, we would expect less selling of gold in a credit crisis for several reasons. The price has not been rising like it was then, so there are likely fewer players on leverage or otherwise so price sensitive. The world had a chance to see the rapid rebound in the gold price after the crisis—it hit its pre-crisis peak less than a year later. And gold is the best asset to own when you don’t trust creditors generally. Finally, the central banks are now ready, willing, and able to pump credit in a crisis. They cannot prevent the collapse of zombies forever, but they may well limit the impact to unrelated markets such as gold.
We have one final thought on the impact of credit events on the gold market. We may be optimists here and showing a not-quite-scientific emotional bias. But we believe that people are learning about the problems of irredeemable debt currencies and central banking. Once someone learns, he does not unlearn. And as we go on, more people are learning. Those who own gold because they understand this are not likely sellers in just the event for which they bought gold in the first place.
Finally, the price of gold is showing some momentum that anyone can see with a price chart. If it continues, then we think it will bring back retail demand. With a new marginal buyer, the trend can continue.
To this, we add our basis analysis. Here is a chart of the price of the dollar in gold terms overlaid with the continuous basis (our measure of abundance) and cobasis (scarcity).
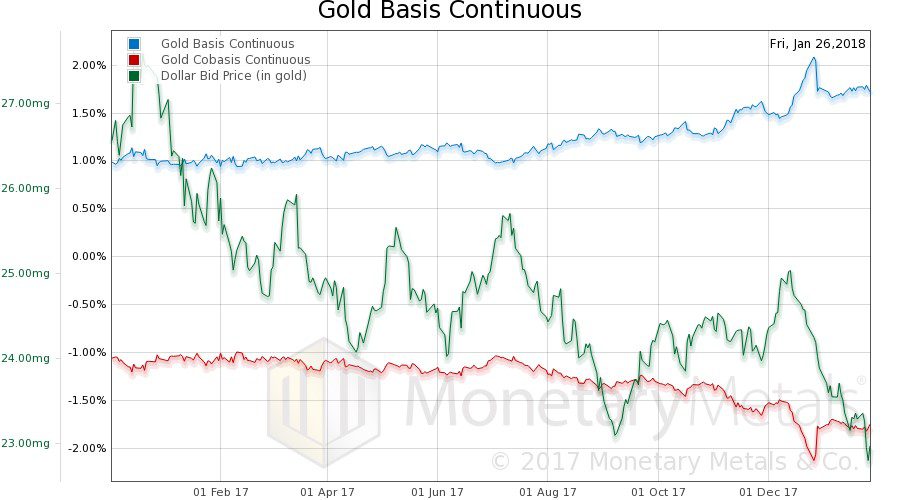
The dollar is going down from almost 27mg gold to under 23mg (that’s $1,130 to $1360 stated in dollar-centric terms). There is an increased abundance of gold at the higher price, but the increase is not commensurate with the price move. In other words, the fundamentals of gold have strengthened during this move and likely were a driver (if not the driver).
Still, it must be noted, there is no backwardation in sight in gold.
In silver, the March contract has moved into what we call temporary backwardation—the tendency of the expiring contract to be pushed down due to selling pressure from traders who roll their positions to the next contract. Here is a similar graph for silver as shown for gold, above.

The basis moves are similar. The price move, not so much. There is little trend.
Our Call
From the crisis through 2011, the prices of the metals ran up due to the inflation trade: “Oh my God, they are printing money to infinity! Buy gold and silver before they go to the moon!”
Then, that trend ended. While the money supply certainly did not collapse, supply and demand fundamentals caused lower prices in one commodity after another. Copper, for example, peaked in early 2011. Oil had an epic collapse. The decline in wheat is still ongoing.
The next several years were a period of despair alternating with hope as the prices of the metals fell and fell, and then rallied. It took from August 2011 when the price of gold hits its peak just under $2,000 until December 2015, when the price hit its trough a bit over half that level.
Since then, we think most chartists would agree that the gold market is in an uptrend. Though there was a big selloff in the second half of 2016, all of 2017 the price was moving up with some corrections along the way.
In years past, we have scoffed at analysts who would take a ruler to the past price trend to predict the next. But right now, we believe that is the most likely course of action.

Our caveat is that this is based on a continuation of the current market environment. One thing we have learned, is that the central planners have more cards of their sleeves than we would think, and they can kick the can farther down the road than we would expect. So we are not predicting a major credit explosion in 2018.
If one occurs, then the assumptions behind this prediction are invalid and our call is moot (in such case we would predict first higher volatility, and maybe a brief drop in price followed by a more rapidly rising price). But in the meantime, this is the most likely path for the gold price.
We noted above that silver has not had much of a price trend over the last year. Arguably, there is a trend over the last half a year. Maybe. So to consider silver, let’s look at the gold-silver ratio. Here is a graph.
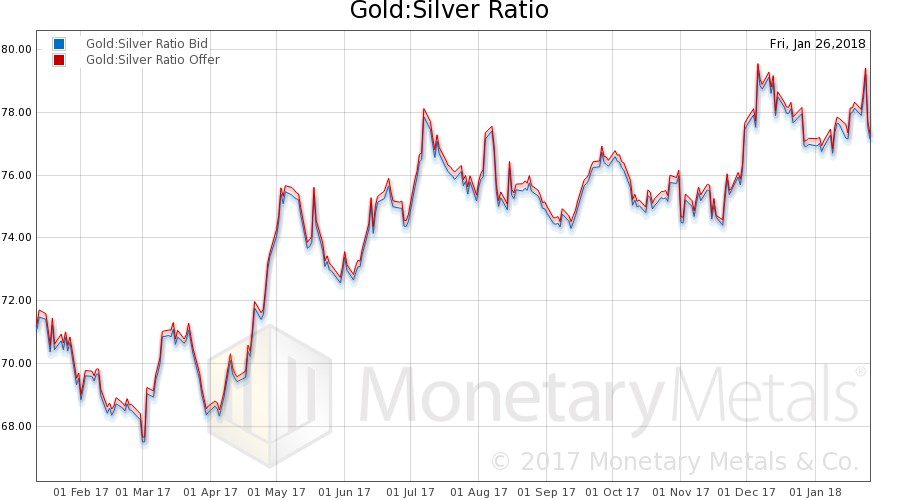
No question, there is an unmistakable rising trend. However, unlike with the price measured in dollars, this number cannot go up indefinitely. Historically, the ratio does not generally get much over 80. Even in the depths of the 2008 crisis, it did not. Note that from 1990 to 1995, it went up over 80 and hit 100 before coming back down to 80 (on its way to 45).
We don’t think the economic environment today is anything like 1990. And we do not expect the ratio to keep moving up.
If the price of gold is $1,450 then at the current ratio of 78, that gives us $18.60. If the ratio drops a bit—i.e. silver gets a bit stronger—to 70, then the price of silver would be over $20.50.
Our silver call is $20 plus or minus.
To anyone who does not yet own gold or silver, we offer the same advice as always. You should own some, period. Without regard to price.
And we think that buying gold or silver now is likely to turn out to be a good deal.
We will continue to chronicle the changing dynamics in the Monetary Metals Supply and Demand Report every week. Subscribers will be the first to see any shift when it occurs. And of course if we see signs of a credit crisis, we will write about it.
It is important to note one caveat. As with equities, fundamental analysis does not help you time the market. Timing is not what we are trying to do. We are doing something that has become unfashionable.
We are interested in valuing the market.
© 2018 Monetary Metals LLC. All Rights Reserved.
")


Leave a Reply
Want to join the discussion?Feel free to contribute!