
Monetary Metals Supply and Demand Report: 14 Dec, 2014
Something big happened in the oil market this week. Gold moved up 15% in terms of oil. Or did the price of oil drop 15% in gold terms? Which should be used to measure which? Here are two graphs to help picture the dilemma.
The Price of Gold Measured in Oil 
The Price of Oil in Gold
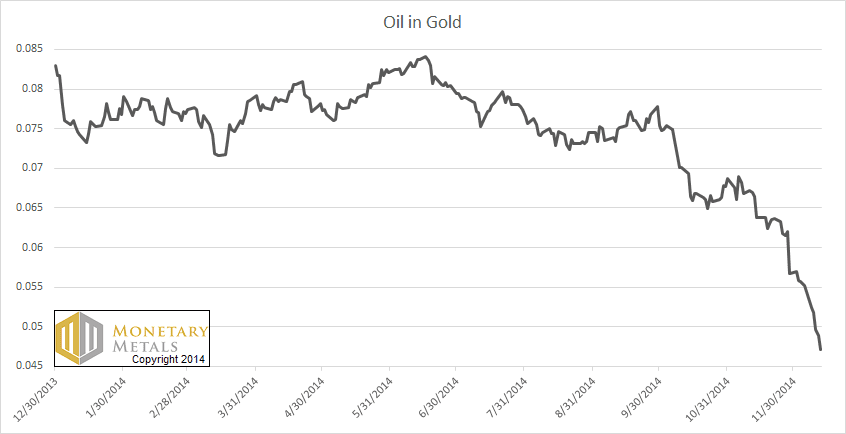
Did oil-denominated investors get rich on their gold speculations? Does anyone count his wealth in barrels of oil?
We recently saw a headline that captures this confusion. It said something like “gold is going up but not for Americans”. But of course, gold is not going anywhere.
Few will defend the proposition that gold went up from 13 barrels per ounce to 21 barrels. Why not? They don’t keep their books in oil, and don’t measure their wealth in oil. They keep their books in dollars, euros, rubles, or Venezuelan bolivars. While it may be a law that forces them to prepare tax returns denominated in their government’s paper scrip, this does not in itself make them think in terms of paper scrip.
“None are so hopelessly enslaved as those who falsely believe that they are free.”
Thus wrote Johann Wolfgang von Goethe. So long as minds cling to the paradigm of the dollar, so long as they regard the fall of paper scrip as an increase of real wealth, people are trapped. I wrote a series of four articles on Forbes looking at the conventional view of inflation, and showing how that view causes many serious mistake. Here is the link to the one on thinking in dollars.
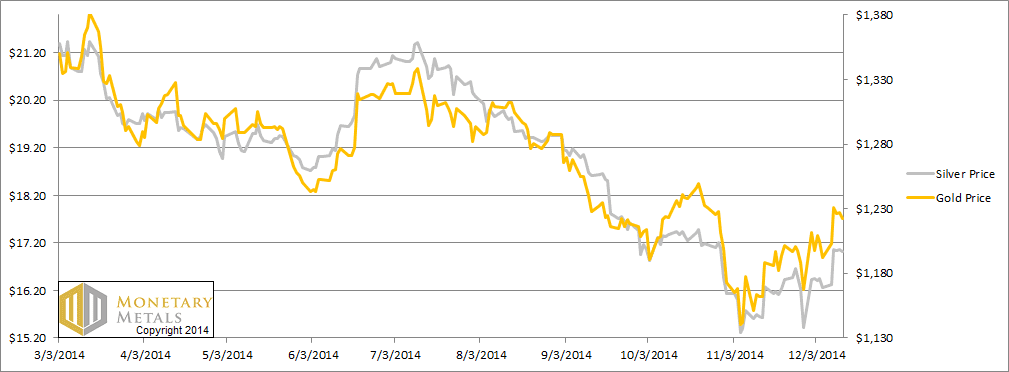
The price of gold rose on Monday and jumped on Tuesday. It ended the week +$30 from last week. The price of silver did the same, only more so, ending +$0.74.
There is an ongoing trend in the supply and demand fundamentals. Read on…
First, here is the graph of the metals’ prices.
The Prices of Gold and Silver
We are interested in the changing equilibrium created when some market participants are accumulating hoards and others are dishoarding. Of course, what makes it exciting is that speculators can (temporarily) exaggerate or fight against the trend. The speculators are often acting on rumors, technical analysis, or partial data about flows into or out of one corner of the market. That kind of information can’t tell them whether the globe, on net, is hoarding or dishoarding.
One could point out that gold does not, on net, go into or out of anything. Yes, that is true. But it can come out of hoards and into carry trades. That is what we study. The gold basis tells us about this dynamic.
Conventional techniques for analyzing supply and demand are inapplicable to gold and silver, because the monetary metals have such high inventories. In normal commodities, inventories divided by annual production can be measured in months. The world just does not keep much inventory in wheat or oil.
With gold and silver, stocks to flows is measured in decades. Every ounce of those massive stockpiles is potential supply. Everyone on the planet is potential demand. At the right price, and under the right conditions. Looking at incremental changes in mine output or electronic manufacturing is not helpful to predict the future prices of the metals. For an introduction and guide to our concepts and theory, click here.
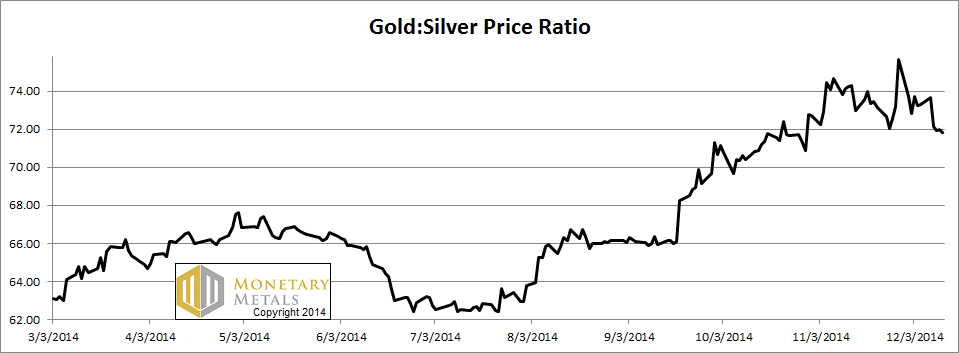
Next, this is a graph of the gold price measured in silver, otherwise known as the gold to silver ratio. It fell a point and a half this week.
The Ratio of the Gold Price to the Silver Price
For each metal, we will look at a graph of the basis and cobasis overlaid with the price of the dollar in terms of the respective metal. It will make it easier to provide terse commentary. The dollar will be represented in green, the basis in blue and cobasis in red.
Here is the gold graph.
The Gold Basis and Cobasis and the Dollar Price
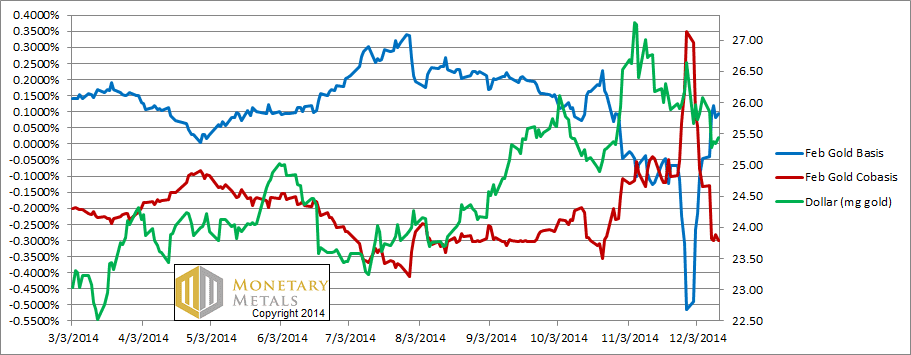
With the rising price of gold there is also rising abundance (blue line). We can speculate why the uptick in buying this week was predominantly futures, but we can’t debate the fact that gold became less scarce at the higher price.
Now let’s look at silver.
The Silver Basis and Cobasis and the Dollar Price
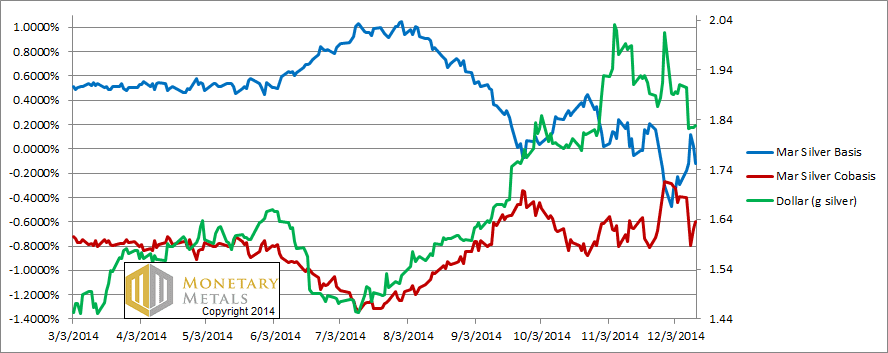
It may be hard to predict the silver price, but here is a prediction of which we can be confident. If the silver price moves up any more, there will be renewed calls for a breakout and the $50 price target will be trotted out again.
In the past, we have channeled Obi Wan Kenobe and other wizards. This time, let’s try Boromir from the Lord of the Rings.
“One does not simply walk into $50 silver.”
It takes a real change on the part of hundreds of millions of small savers around the world, buying metal and hoarding it.
That is not the picture depicted by the silver graph today.
© 2014 Monetary Metals
Many thanks,timimg is everything
Keith, as always, thanks for your commentary. I wonder if you’d be able to leave out the large quotations marks in the future? I have trouble reading the text they cover and I know other readers of yours have said the same in previous comment sections so it’s not just me. Thank you!!
Thanks for the feedback, I didn’t realize there was a formatting problem. I have just been using the WordPress quotation feature. I will see what else I can do.
FWIW, Firefox browsers since at the latest 2008 have formatted large font intrusions correctly. I’m not sure what lame browser couldn’t – maybe one of the mobile device browsers. Here is a tutorial if you want to try something more conservative.
Thanks Keith!!
Are you still estimating $1,250 gold from your post three weeks ago? On what basis did you make that “price” target?
Lower now. I have built a model…
Keith – I just finished reading some of Charles Savoie’s work about the Pilgrims and their war on monetary silver – seems as though us PM bugs have quite a mountain to climb! True price discovery appears to be very elusive and getting more so. How many sources of bids and offers do you consider in your analysis? Do massive trades b/t dark pools taint the data? Have the CB’s and affilates essentially cornered the market already?
Thank you for the education you are providing.
Thanks Keith.