
Monetary Metals Supply and Demand Report: 1 Feb, 2015
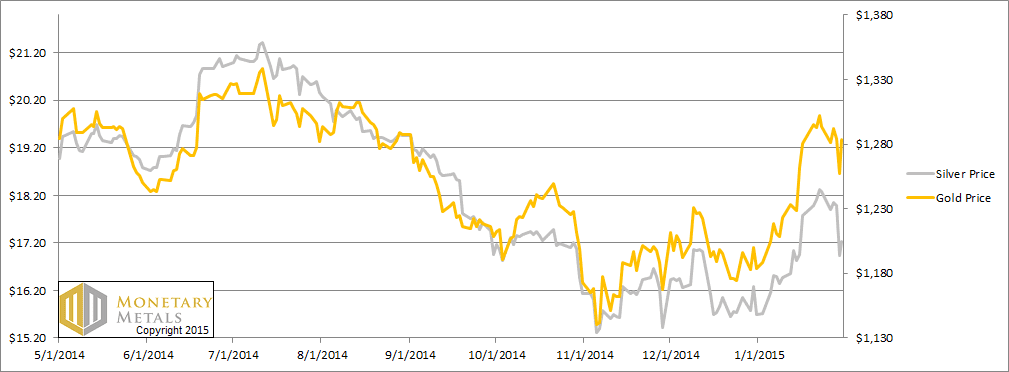
There was some big price news this week. We gold thinkers say that the dollar jumped over ½ mg gold, and 100mg silver on Thursday. Harry Potter’s muggles would say gold fell to $1257 and silver to $16.94 before gold bounced back to nearly unchanged and silver bounced much less. All can agree that the gold to silver ratio rose sharply, up almost 4 points or 5.2%.
Pay attention to the currencies market. The Russian ruble fell more than 8% in dollar terms, the Brazilian real fell almost 4%, and the Swiss franc fell more than 4%. If you’re picturing an iceberg, that’s about it—more under the surface than what’s visible.
For an updated look at what’s going on beneath the surface of the gold and silver markets, read on…
First, here is the graph of the metals’ prices.
The Prices of Gold and Silver
We are interested in the changing equilibrium created when some market participants are accumulating hoards and others are dishoarding. Of course, what makes it exciting is that speculators can (temporarily) exaggerate or fight against the trend. The speculators are often acting on rumors, technical analysis, or partial data about flows into or out of one corner of the market. That kind of information can’t tell them whether the globe, on net, is hoarding or dishoarding.
One could point out that gold does not, on net, go into or out of anything. Yes, that is true. But it can come out of hoards and into carry trades. That is what we study. The gold basis tells us about this dynamic.
Conventional techniques for analyzing supply and demand are inapplicable to gold and silver, because the monetary metals have such high inventories. In normal commodities, inventories divided by annual production (stocks to flows) can be measured in months. The world just does not keep much inventory in wheat or oil.
With gold and silver, stocks to flows is measured in decades. Every ounce of those massive stockpiles is potential supply. Everyone on the planet is potential demand. At the right price, and under the right conditions. Looking at incremental changes in mine output or electronic manufacturing is not helpful to predict the future prices of the metals. For an introduction and guide to our concepts and theory, click here.
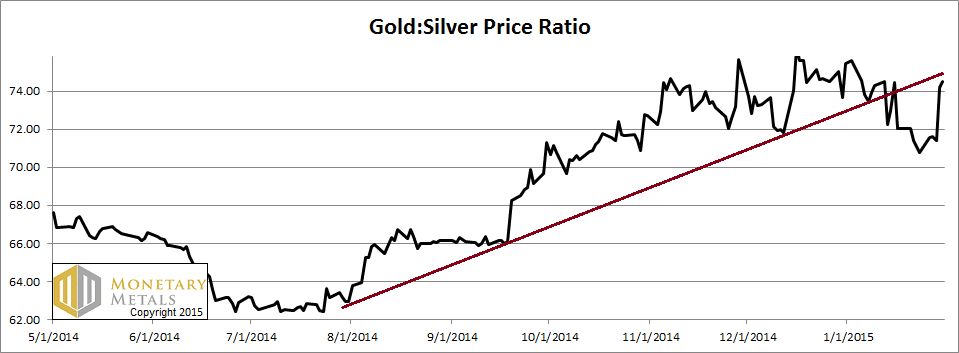
Next, this is a graph of the gold price measured in silver, otherwise known as the gold to silver ratio. It moved up sharply.
It had broken down from technical standpoint. It’s almost back to re-crossing the line. We’ll leave the analysis of this to technicians. We have our own view of the likely direction (up) of this ratio, based on the fundamentals.
Keep reading…
The Ratio of the Gold Price to the Silver Price
For each metal, we will look at a graph of the basis and cobasis overlaid with the price of the dollar in terms of the respective metal. It will make it easier to provide terse commentary. The dollar will be represented in green, the basis in blue and cobasis in red.
Here is the gold graph.
The Gold Basis and Cobasis and the Dollar Price
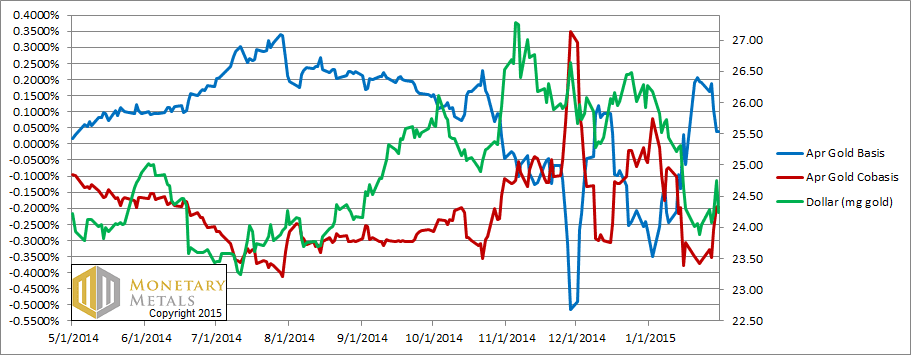
The gold price is down $10 (i.e. the dollar price is up), and what do we see? The cobasis (scarcity) is rising sharply (currently above -0.2%). A sign of firming up for now, or perhaps a bigger move is developing.
Our fundamental price for gold is $50 over the market price. This does not mean that the market price necessarily has to rise (much less rise tomorrow morning). It’s just a way of putting supply and demand into context, and estimating a likely path for the gold price to take.
Now let’s look at silver.
The Silver Basis and Cobasis and the Dollar Price
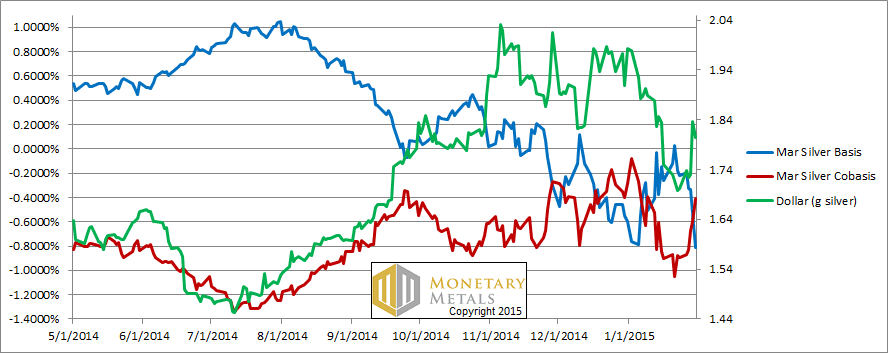
In silver terms, the dollar had a big move up this week, +6.5% (in dollar terms, silver fell).
The silver cobasis (scarcity) rose quite a bit. This is not surprising as we approach First Notice Day and speculators have to sell their March silver positions. The selling pressure becomes intense, and the new normal post-2008 is temporary backwardation for expiring contracts about this far out. Not happening yet (and farther contracts had much smaller gains in their cobases). Cobasis = spot – future (to oversimplify slightly), so heavily selling of a future pushes the cobasis up.
Silver is in a very different market dynamic than gold right now. Everyone knows that when the gold price goes up, then the silver price has to go up 2X or more. However, there is some tightness in the gold market (hence our fundamental price $50 above the current market) and none in silver.
Last week, we honored Gandalf and Frodo, in order to make our point about a possible drop in the price of silver. This week, at the top of the Report, we foreshadowed that we will look to the Harry Potter series this time.
“The silver.” Dumbledore sighed. “It is a beautiful and terrible thing, and should therefore be treated with great caution.”
Our calculated fundamental price is about $2.35 under the market price.
What could cause this disparity? In a word: credit. Take a look at this graph.
The Gold to Silver Ratio and Credit Spread
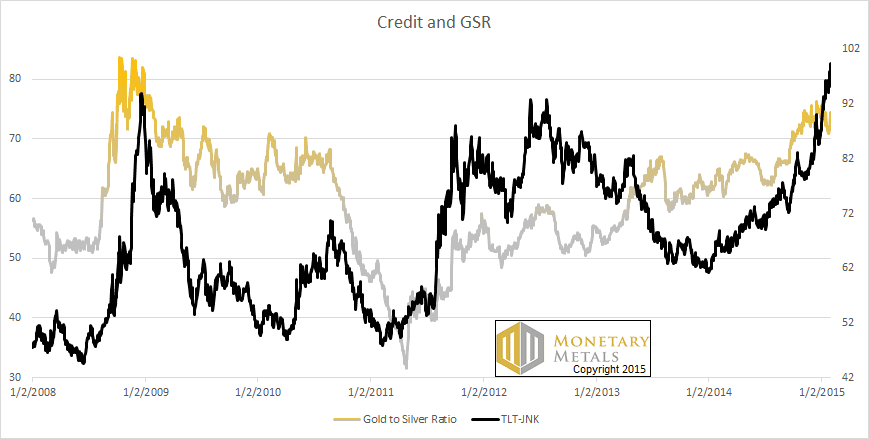
The correlation isn’t perfect, but it’s pretty clear. The credit spread is TLT-JNK, a measure of how much more expensive junk credit is than Treasury. As this rises, we would expect weaker fundamentals for silver including industrial demand and speculation.
Another way of looking at it is when people seek safety, they tend to turn to gold more than silver. At least that’s how it is currently.
© 2015 Monetary Metals
Keith.
What about a bit of Bonnie and Clyde?
That aside, I have long suspected that in a slowing industrialised world, the price of silver would head down.
From a technical analysis monthly perspective, silver is in a strong downtrend and no turn in sight.
$8.50 will not surprise me !
Again…thanks for your analysis. Very interesting.
SW
Thanks, Keith. My tentative hold on the new paradigm weakens when currency numbers enter the picture. By design, I’m sure, to distract and confuse. Perhaps a table of “prices” denominated in gold/silver for something other than currencies might be a helpful reinforcement. Is such a table available to us?
There is site dedicated to pricing different things in gold. It is http://www.pricedingold.com.
@Freeman
In addition to the link that Keith provided, In a 1997 essay, “A Gold Standard Today” (when gold was around $350), George Reisman discussed how one can mentally create his own gold standard to express prices of goods and services now. He showed how to transition from thinking in fiat to thinking in bullion terms. You can find his essay at http://www.capitalism.net. In 2011 the people at Eidetic Research updated Reisman’s figures to reflect gold at $1800 and they also worked up some numbers for silver priced at $5 and $40. Their website is http://www.eideticresearch.com. You can use either essay as a guide to figuring out bullion based prices at current fiat values.
Keith:
Thank you for your valuable insight and information. Like you, I learned to price goods and services in real money. Only in my case, instead of grams, I choose traditional US specie in the form of Treasury gold coins, Standard silver dollars, and subsidiary silver dimes, quarters, and halves (the latter humorously called “junk silver” by novices and pedants who know no better).
Fortunately, as a teenager, I witnessed the transition from silver to clad (base-metal) coins, and from silver promises (Certificates) to Federal Reserve IOU-nothings. I understood what was going to happen to our money in 1964-68, while it was happening.
When I first began driving in 1967, gasoline was priced 25¢ to 30¢ per gallon here in the Los Angeles area. In other words, the equivalent of 2.5 to 3 silver dimes. We were still using silver coins then, Gresham’s Law having yet to complete its inevitable operation. Standard silver dollars pretty much disappeared from circulation around 1965, but I did spend them as a kid before then. Many in the numismatic community in those days were fully aware the long-dead Thomas Gresham would prevail, and why.
Just recently, the silver-dime to gasoline ratio has reached an unbelievable 1.8 dimes to the gallon (currently, Feb 2, 2015, it is 2.0 dimes). Never before have I seen gas this cheap. A friend in Virginia (also a coin dealer) reports 1.5 silver dimes per gallon. The range in my lifetime (b.1950) has been 27¢ to about $4.50 in currency units, and about 2.5 to 4.5 silver dime-equivalents per gallon, but never this cheap.
Prices in gold coins (grams to you, US Treasury Gold Dollars to me = 1/20th of a $20 gold Double Eagle) are so incredibly low as to be almost give-away prices: over 24 gallons per gold dollar.
This of course only applies to those actually owning specie. Silver and gold money are easy to exchange at any money changer’s place of business for the Federal Reserve units that people seem to fawn over and Legal Tender laws seem to require.
Even before I became a numismatist and then a coin dealer (the latter, in 1969), I understood that there never was a prohibition on American buying, selling, or owning gold from the supposed outlawed years of 1933-74. Like most silly laws passed for political convenience, this one was ignored by one and all. I bought my first English gold sovereign in 1965 for $9.25, that being the retail (or Ask) price. Melt at the time (0.2354 oz X $35 was $8.25 in round numbers), while dealer wholes or Bid was $8.75.
If you have any interest in this, please ask me about what just occurred in the last few weeks with the price of US collector gold coins in circulated grades all the way to MS63/64. Something that has never been seen before (or at least, since 1933).
John
Well with a teaser like that I am certainly interested. What has happened in the last few weeks with the price of US collector gold coins?
Thank you. Briefly, they collapsed to “scrap” value. Most circulated $5, $10, and $20 gold coins from Very Fine grade to “Commercial Uncirculated” now trade wholesale at spot to 2% back of spot. Rare dates for now seem to have avoided the carnage. Mint State 60 to 63 (the low end grades, I assume you are familiar with the 70-point grading scheme) now also Bid close to scrap. Saint-Guadens Double Eagles, which have to compete head to head with modern Gold Eagles & Maples, etc. in the 1-ounce category, have similarly melted in price, with a medium sized retailer this last Friday at the Long Beach coin show explaining MS63 Certified (PCGS & NGC) Saints were Bid at 3% over spot, and a deal with a couple of thousand MS64s traded at 7% over spot. In times past, the MS64s were 20% to 25% over. Apmex.com shows slightly higher Bid prices. The there were long faces at Long Beach all the same.
This dealer I spoke to tells me he will begin arbitraging the drop (my word, not his) by promoting the cheaper coins to his customers wanting Eagles or Buffaloes. He also expects that once the Cable TV coin operators begin their next promotions, they’ll be big buyers since they can tout the tight spreads.
I talked to Austin, Texas dealer Dave Carruthers who has been in the business as long as I have (though I am retired now) who confirmed that in his 40 year career he has never seen pre-1933 US gold coins trading at “scrap” value.
What does it mean? I have no idea. Perhaps today’s generation of gold buyer, never having collected earlier US coins, prefers bullion coins. Easier to figure the price. Also, endless negative publicity from websites selling bullion products have steered new investors away from “rare” coins because of their markups.
Or there may be simply too many coins for the market to support. They have finally returned to monetary items.
I’ve always owned early US gold with the idea in mind that I might spend it one day. The collector premiums, predicated on there BEING collectors, might have finally disappeared on the commonest coins (millions of US gold coins never went into the Mint’s melt pots in 1934-37 to be made into coin-melt bars).
Also, over the holidays, MS65 graded common Morgan dollars saw their Bids drop from $150 to $95. Of silver dollars in all grades, several million exist. One example: when the vaults of the failed Continental Illinois Bank were opened after its 1984 collapse, there were 1.1 million 1881-S Morgan Dollars found in their reserves. Bags and bags of original Mint States.
John
Thanks for sharing that johnmurbach. I am a student of spreads. Spread, not price, is what tells you what’s really going on.
My interpretation is that the speculators have left the room (in gold, at least). I think this is a good thing, though obviously those who want gold to “go up” are frustrated because it is speculators who push up the price and the source of “profits”.