
Monetary Metals Supply and Demand Report: 30 Nov, 2014
The fireworks came this week, with a vengeance—and we do not mean the price moves in the metals.
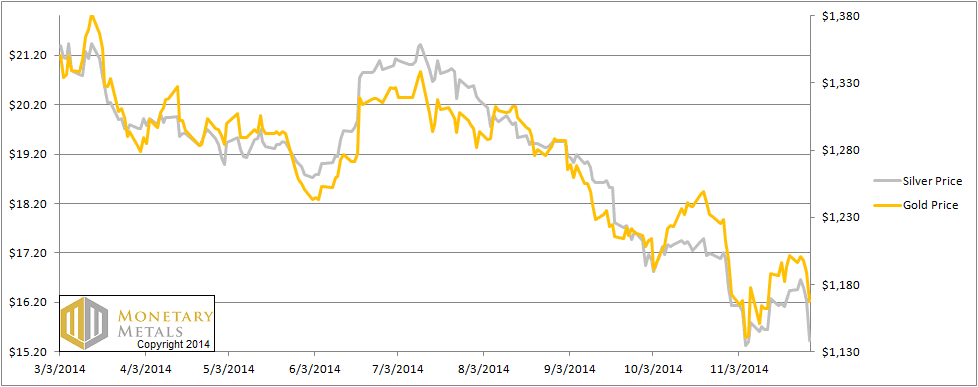
The gold price fell $34, or 2.8%. The silver price fell exactly $1, or 6.1%. We are careful to say that it is the price—the exchange rate to dollars—that goes up or down. Gold does not go anywhere. In reality, it’s the dollar that moves. Mostly it moves down, especially over the long term. But it can move up sharply as it did this week.
The dollar went up from 25.9mg gold to 26.7 milligrams, or if you prefer 1.9g silver to 2 grams.
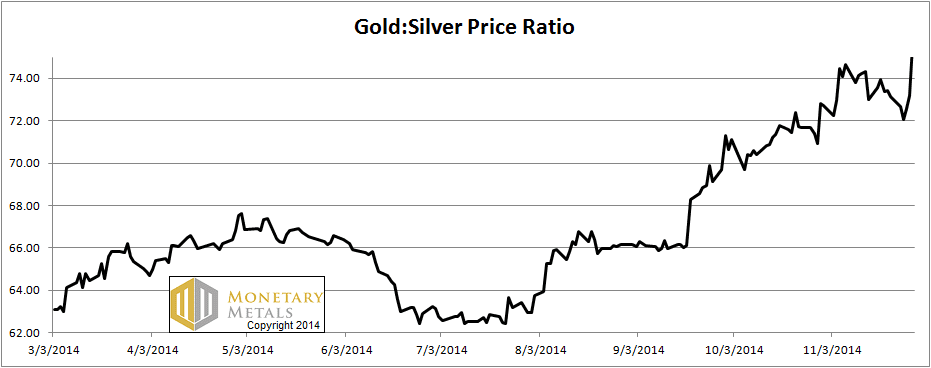
The gold to silver ratio hit over 76 on Friday before subsiding to its close of 75.7. We previously called for 75, and maybe 80. With this target officially reached in a weekly close, we will stick with our call for likely further upside in the ratio. We could see 80 or higher.
The fireworks occurred, not in the price, but in the basis. The basis is our unique measure of supply and demand fundamentals. To see a clear picture you will not get anywhere else, read on…
First, here is the graph of the metals’ prices.
The Prices of Gold and Silver
We are interested in the changing equilibrium created when some market participants are accumulating hoards and others are dishoarding. Of course, what makes it exciting is that speculators can (temporarily) exaggerate or fight against the trend. The speculators are often acting on rumors, technical analysis, or partial data about flows into or out of one corner of the market. That kind of information can’t tell them whether the globe, on net, is hoarding or dishoarding.
One could point out that gold does not, on net, go into or out of anything. Yes, that is true. But it can come out of hoards and into carry trades. That is what we study. The gold basis tells us about this dynamic.
Conventional techniques for analyzing supply and demand are inapplicable to gold and silver, because the monetary metals have such high inventories. In normal commodities, inventories divided by annual production can be measured in months. The world just does not keep much inventory in wheat or oil.
With gold and silver, stocks to flows is measured in decades. Every ounce of those massive stockpiles is potential supply. Everyone on the planet is potential demand. At the right price, and under the right conditions. Looking at incremental changes in mine output or electronic manufacturing is not helpful to predict the future prices of the metals. For an introduction and guide to our concepts and theory, click here.
Next, this is a graph of the gold price measured in silver, otherwise known as the gold to silver ratio. It rose 2 ½ points this week, or 3.5%.
The Ratio of the Gold Price to the Silver Price
For each metal, we will look at a graph of the basis and cobasis overlaid with the price of the dollar in terms of the respective metal. It will make it easier to provide terse commentary. The dollar will be represented in green, the basis in blue and cobasis in red.
Here is the gold graph.
The Gold Basis and Cobasis and the Dollar Price
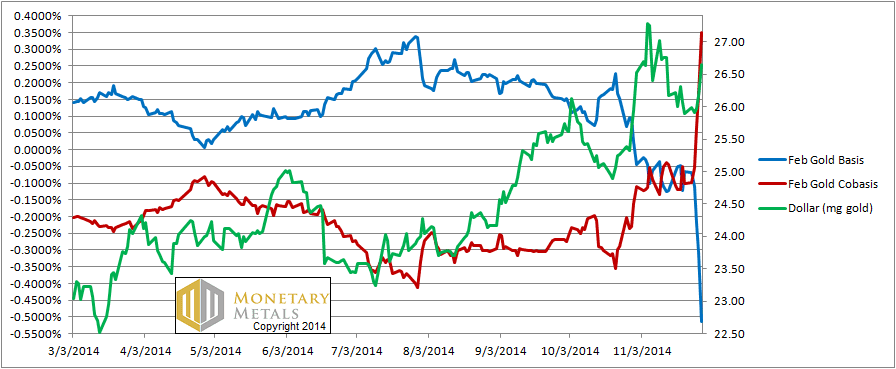
If that red cobasis (scarcity) line shooting from -0.1% to +0.4% isn’t fireworks, then what is? OK ok, we’re econ geeks.
Are the buyers of metal finally coming to the market? Given the dropping price, we think it’s more accurate to say that sellers of metal are not coming to market. But paper speculators are tripping over themselves and each other to dump their futures contracts.
Last week, we said:
The February basis is just below zero and the cobasis now stands at -0.1%. These are hardly normal readings, but not atypical in the post-2008 reality.
Here is a picture of the cobasis going out through the end of next year.
The Gold Cobasis to December 2015
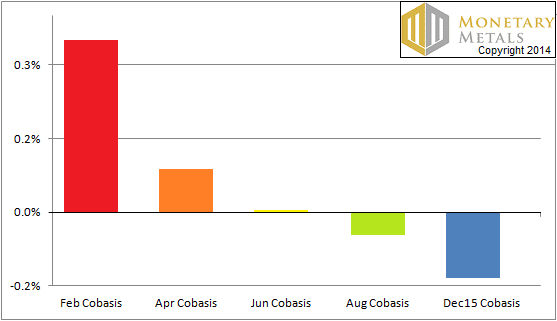
This, on the other hand, is atypical. Four contracts (including the expiring December contract, not shown) are now backwardated (cobasis > 0). Prior to this, the most we’ve seen is three. We wrote an update on August 1, 2013. The August (2013), October, and December contracts were backwardated at that time. The December contract first had a positive cobasis (our strict definition of backwardation) on July 31, or 67 days before Dec 1.
Well, now we have shattered that record. The June 2015 contract plunged into backwardation on Friday, November 28. That is exactly half a year, or 130 trading days (not counting holidays) until June 1. Backwardation has crept from the expiring near month out nearly twice as far out as compared to the last incident.
Ladies and Gentlemen, boys and girls, this is serious.
We suspect that this time, it’s a matter of price. We believe that when the price rises enough, this backwardation will subside.
However, the fact that backwardation can occur at all is pathological. It shouldn’t happen. The fact that it can occur in contracts beyond the expiring near month makes it more serious. Creeping out to six months? This is like a rot, or a cancer, growing and spreading. It’s like negative interest rates on German bonds out to 3 years, or Swiss bonds out to 5 years. It. Should. Not. Be.
There will come a day when the price is rising (probably exponentially) and the cobasis will also be rising (probably also exponentially). When that happens, then what everyone thinks of as money (i.e. the dollar) will be done. Stick a golden fork in it.
Thursday was Thanksgiving, a major holiday in the US and Friday was a shortened trading day and probably had poor liquidity. So we might be somewhat inclined to take this development with a grain of salt. Only somewhat.
This might be a good time to go naked long gold, especially if you like to jump on the leading edge. We really want to see what happens this week, not only to the price, but to the basis also.
Here is a different look at what happened this week.
Open Interest in Gold Futures
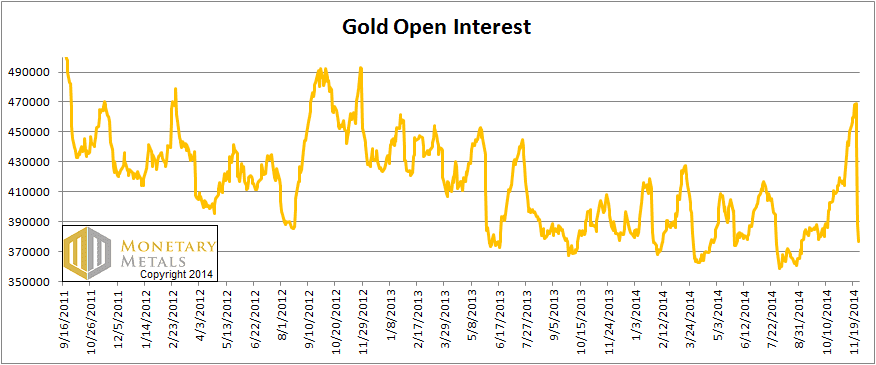
This graph shows the number of open contracts in the COMEX futures market going back to the start of the gold price decline in September 2011. Let’s focus on that vertical drop on the right edge of the graph. That occurred this week. The number of gold contracts fell massively, from 468,748 contracts last Friday to 376,407 this Friday. That is a drop of 92,341 or 20%. This plunge occurred in just 3 days, Mon-Wed (Thursday was a holiday and Friday had little change).
The open interest had been near the high end of the post-2011 range and now it has fallen to near the low end.
As we’ve written before, open interest does not decline due to price drops or selling per se. Equities, for example, can drop and the number of shares does not change. Open interest rises when arbitragers see an opportunity to carry gold. When the basis is positive, anyone can buy a gold bar and sell a future, to pocket a small spread (i.e. the basis). The warehouseman takes no price risk. Open interest rises as more traders warehouse gold—also called carrying the metal.
On the other hand, when the cobasis is positive, anyone can sell a gold bar and buy a future. This is known as decarrying, and will tend to cause the open interest to fall.
The collapse in open interest, combined with the sudden metastasizing of backwardation half a year out looks like it may be a major capitulation in the gold market. This doesn’t mean that there couldn’t be a bit more selling, especially when the market wakes up to the news from Switzerland. They had an initiative that would have required their central bank to buy and hold gold. Swiss voters said no on Sunday November 30.
Now let’s look at silver.
The Silver Basis and Cobasis and the Dollar Price
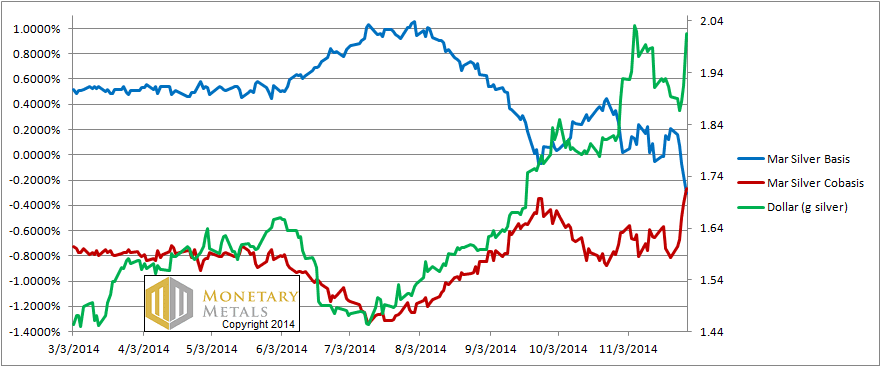
In silver, we see nothing out of the ordinary. The dollar rose (i.e. the price of silver fell), and with it silver became more scarce (i.e. higher cobasis). But not that scarce. The March cobasis is still well within negative territory and there is no backwardation in this metal.
Most unlike in gold, the fundamental price of silver is still a bit below the market price.
© 2014 Monetary Metals
Fools rush in where…….
[the darkness still has work to do from here to year-end]
Keith,
Shouldn’t the rot come from Long to short contracts? What does it implie that the opposite happens?
Why should longer contracts be more trusted than short?
Magnus
Magnus,
That is a very interesting question. I think one could write a serious paper on the topic of whether backwardation should start with the long-term contracts or the short.
I addressed only the short to long case, because that’s what happened on Friday. There is a consistent tendency of the near contracts to have a falling basis (though not contracts out so far).
In monetary collapse, would it be the long contracts where the bid collapses first? I think a case could be made either way. Pro: people will distrust a multiyear contract before they worry about a contract that will deliver in 60 days. Con: there is little open interest so far out, so a collapsing bid will not necessarily drag down the offer. And backwardation is when cobasis > 0 which is when the bid on spot > offer on the future.
On the other hand, when the cobasis is positive, anyone can sell a gold bar and buy a future. This is known as decarrying, and will tend to cause the open interest to fall.
…so with gold cobasis well in the positive territory, we should expect more physical gold selling?
mdrgosi: You should not think of carrying as buying, nor decarrying as selling. These are arbitrages that affect the basis, but not what outside observers see as the price.
Many thanks for the update Keith
Hi How do the negative GOFO rates figure into this scenario These rates have been negative for the past month and increasingly so. This Am the one month rate is -0.58. Seems to me that this is another indication that there is scarcity of gold
jfbastian: I wrote an article in 2013 discussing the correlation between GOFO and the basis, just Google (I am on the run so I don’t have time to dig up the URL at the moment)
GOFO is getting closer to 0 today, I guess they have found some few gold bars to sell/lease.