
Monetary Metals Supply and Demand Report: 4 Jan, 2015
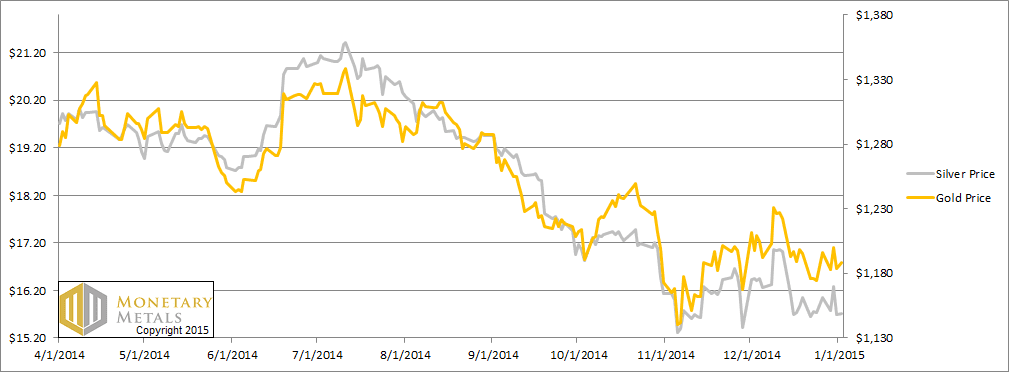
This was another short week. The prices of the metals dropped, gold a little and silver a little more. Silver, once again, exchanges for dollars with a 15 handle.
For an updated picture of the fundamentals read on…
First, here is the graph of the metals’ prices.
The Prices of Gold and Silver
We are interested in the changing equilibrium created when some market participants are accumulating hoards and others are dishoarding. Of course, what makes it exciting is that speculators can (temporarily) exaggerate or fight against the trend. The speculators are often acting on rumors, technical analysis, or partial data about flows into or out of one corner of the market. That kind of information can’t tell them whether the globe, on net, is hoarding or dishoarding.
One could point out that gold does not, on net, go into or out of anything. Yes, that is true. But it can come out of hoards and into carry trades. That is what we study. The gold basis tells us about this dynamic.
Conventional techniques for analyzing supply and demand are inapplicable to gold and silver, because the monetary metals have such high inventories. In normal commodities, inventories divided by annual production can be measured in months. The world just does not keep much inventory in wheat or oil.
With gold and silver, stocks to flows is measured in decades. Every ounce of those massive stockpiles is potential supply. Everyone on the planet is potential demand. At the right price, and under the right conditions. Looking at incremental changes in mine output or electronic manufacturing is not helpful to predict the future prices of the metals. For an introduction and guide to our concepts and theory, click here.
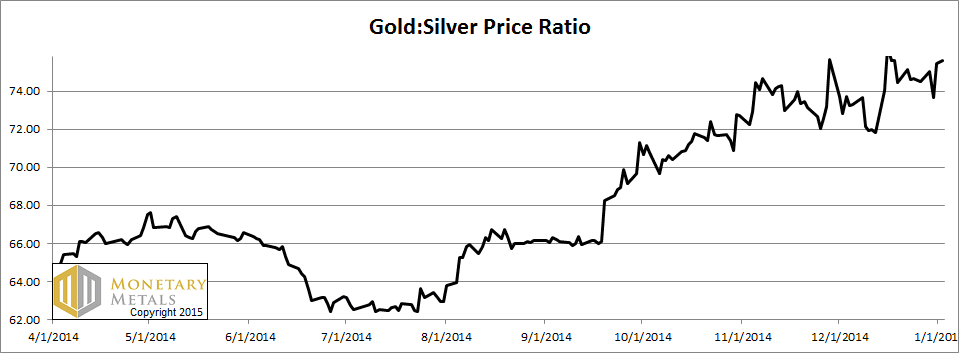
Next, this is a graph of the gold price measured in silver, otherwise known as the gold to silver ratio. It moved up.
The Ratio of the Gold Price to the Silver Price
For each metal, we will look at a graph of the basis and cobasis overlaid with the price of the dollar in terms of the respective metal. It will make it easier to provide terse commentary. The dollar will be represented in green, the basis in blue and cobasis in red.
Here is the gold graph.
The Gold Basis and Cobasis and the Dollar Price
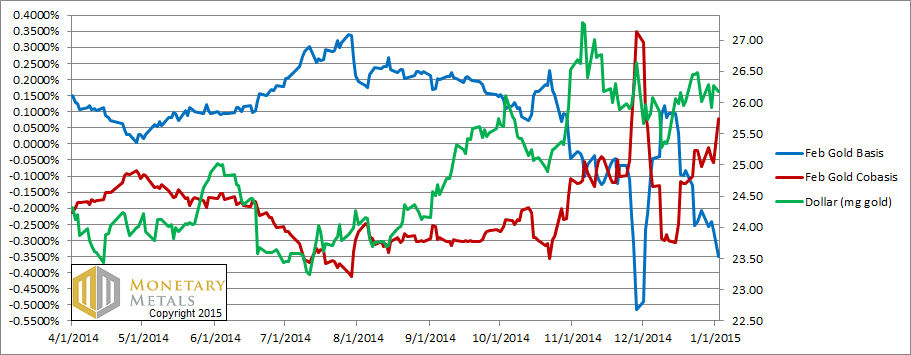
Look at that. Backwardation is back in the February contract. This is the fairly typical pattern in the post-2008 “new normal”. As the selling pressure mounts on the near-expiring contract, we get a little temporary backwardation.
A sign the fundamentals of gold are firming up. A little bit.
Now let’s look at silver.
The Silver Basis and Cobasis and the Dollar Price
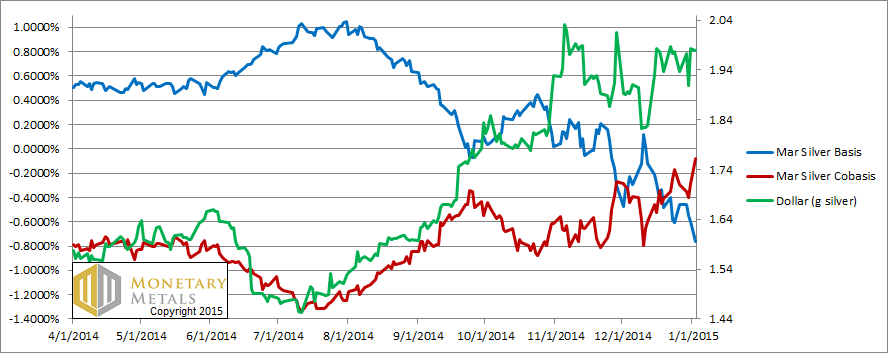
A slight rise in the cobasis (scarcity) of silver as well.
© 2015 Monetary Metals

Keith,
I know you don’t believe in manipulation of PM prices. I was wondering if you would have any input on Paul Craig Roberts’ articles, such as…
http://www.paulcraigroberts.org/2014/12/22/lawless-manipulation-bullion-markets-public-authorities-paul-craig-roberts-dave-kranzler/
He has an impressive list of credentials, as well as being the father of Reaganomics.