
Monetary Metals Supply and Demand Report: 8 Mar, 2015
Last week, we borrowed a phrase from Gandalf in the Lord of the Rings. We said it felt like, “the deep breath before the plunge”. We added, “We don’t necessarily mean a plunge in the price of gold measured in dollars. It could be a plunge in the price of the dollar. And there are many other currencies that look ready to plunge.”
Well, it was a $46 plunge in the price of gold. In dollars, the price of gold fell to $1,167. In gold, the dollar jumped a full milligram, to 26.7mg gold.
We were spot-on about currencies. This week, the euro fell 3.2% to $1.08, a new low. The Brazilian real fell 6.7%. The Swiss franc fell 3.5%. When we wrote to predict the collapse of the Swiss franc, it was trading around $1.14. A little over a month later, it is now down to $1.01 or -11.4%. That is a big move for any currency, and a big letdown for anyone who thinks of the franc as the gold standard of paper currencies.
We like to look at the currencies. One, they’re an indicator of what’s happening in the world of credit. The prices of the metals can rise or fall based on whether credit is expanding or contracting.
More importantly, it underscores that gold should not be measured in paper currency, and a rise in the gold price is not a gain. It is merely an artifact of a drop in paper. If we look at gold as Brazilians would see it, the price has risen from 3220 real at the start of the year to 3579 real on Friday, or +11%. Does anyone think gold-holding Brazilians are getting richer?
Of course not. We can see that their currency is falling. It’s only hard to see when it’s our own, the dollar (for most readers).
For a picture of the supply and demand fundamentals of gold and silver, read on…
First, here is the graph of the metals’ prices.
The Prices of Gold and Silver
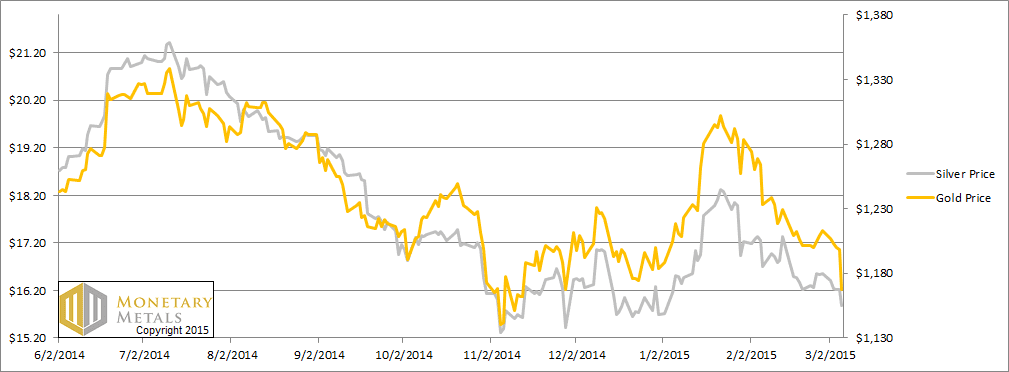
We are interested in the changing equilibrium created when some market participants are accumulating hoards and others are dishoarding. Of course, what makes it exciting is that speculators can (temporarily) exaggerate or fight against the trend. The speculators are often acting on rumors, technical analysis, or partial data about flows into or out of one corner of the market. That kind of information can’t tell them whether the globe, on net, is hoarding or dishoarding.
One could point out that gold does not, on net, go into or out of anything. Yes, that is true. But it can come out of hoards and into carry trades. That is what we study. The gold basis tells us about this dynamic.
Conventional techniques for analyzing supply and demand are inapplicable to gold and silver, because the monetary metals have such high inventories. In normal commodities, inventories divided by annual production (stocks to flows) can be measured in months. The world just does not keep much inventory in wheat or oil.
With gold and silver, stocks to flows is measured in decades. Every ounce of those massive stockpiles is potential supply. Everyone on the planet is potential demand. At the right price, and under the right conditions. Looking at incremental changes in mine output or electronic manufacturing is not helpful to predict the future prices of the metals. For an introduction and guide to our concepts and theory, click here.
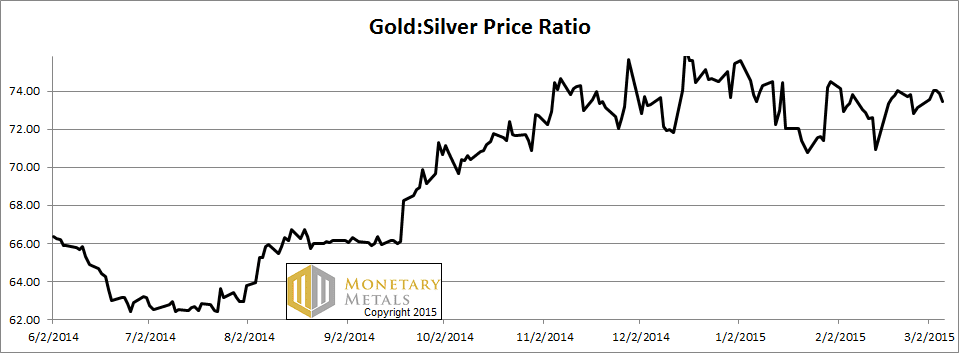
Next, this is a graph of the gold price measured in silver, otherwise known as the gold to silver ratio. It moved up this week, but not by much. That is remarkable because the prices of the metals dropped significantly. Typically, when the prices of the metals drop, the price of silver drops more than that of gold.
The Ratio of the Gold Price to the Silver Price
For each metal, we will look at a graph of the basis and cobasis overlaid with the price of the dollar in terms of the respective metal. It will make it easier to provide brief commentary. The dollar will be represented in green, the basis in blue and cobasis in red.
Here is the gold graph.
The Gold Basis and Cobasis and the Dollar Price
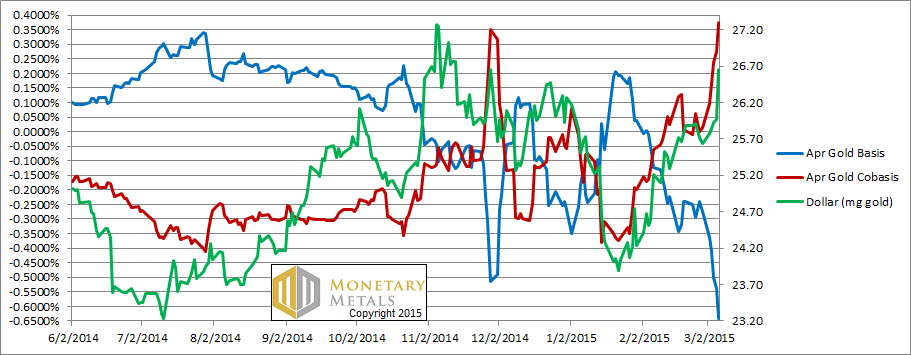
This is a very interesting picture. Everyone knows that the price of gold fell every day this week, particularly on Friday. Only those looking at this graph see that the scarcity of gold (i.e. the cobasis, the red line) rose every day this week. The green trace (i.e. the price of the dollar, in gold) has been closely tracking the cobasis since the start of the year.
This tells us that the price drop is currently driven by speculators (i.e. selling futures) this week. The fundamentals of gold did not change. We calculate and update every day a fundamental price, which comes from our model. This fundamental price is up $3 on a week in which the market price fell by $46. Last week, we said the fundamental price was $50 over the market price. It is now almost $100 above.
The April gold contract is now in backwardation. One could make 38 basis points (annualized) to sell a gold bar and simultaneously buy an April contract. In April, you will have the same gold as you started with, plus a profit for your troubles. 38 bps may not sound like a lot, but where else can you make that profit on a 2-month investment. There should not be a risk-free profit on this trade, as there should never be such a thing as a shortage in a commodity that’s not consumed and which has been accumulated for thousands of years.
You should think of backwardation as a sign of shortage or scarcity.
Now let’s look at silver.
The Silver Basis and Cobasis and the Dollar Price
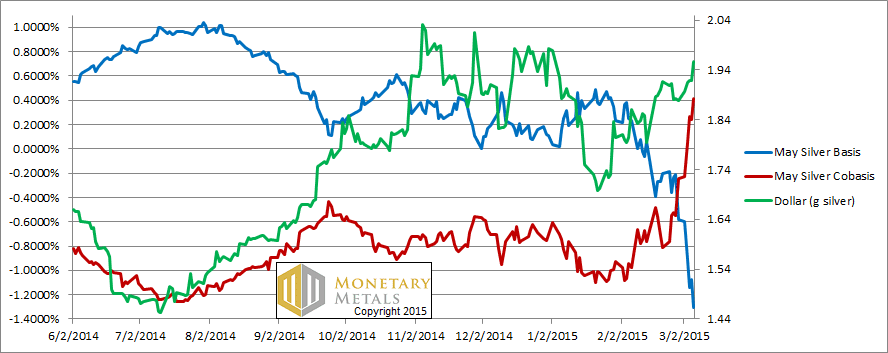
The picture is similar in silver. We have a big rise in the cobasis along with the price of the dollar in silver. Like April gold, May silver is also in backwardation.
At these lower prices, well under $16, silver is not so abundant as it was when it was over $18.
Our calculated silver fundamental price moved up about a quarter dollar. The market price dropped 67 cents. Last week, we observed the fundamental price was “more than a buck fifty below the market price.” Well, now the market is less than 50 cents overpriced by our model.
If the fundamentals continue to tighten another week like this, things could get interesting in the silver market. We wouldn’t recommend that bet just yet.
© 2015 Monetary Metals
Thanks, Keith. Very interesting. Any idea how the current backwardation compares with the peak in 2008 as I’d be interested in how much tighter the market can become before some real price relief.
Mark
Backwardation today is not large.
How does this backwardation compare to one from last nov/dec? At that time, the (now discontinued) GOFO was at record lows.
It looks venezuela is going to “monetize” its gold so there would solve this little current backwardation as we are speaking of about 1.4 million gold ounces :
http://www.zerohedge.com/news/2015-03-11/venezuela-begins-liquidating-its-gold