
Paper Gold Is Rising, Report 1 May, 2016
The price of gold shot up over $60 this week. The price of silver moved up proportionally, gaining over $0.85. The mood is now palpable. The feeling in the air is that of long suffering suddenly turned to optimism. Big gains, if not the collapse of the price-suppression cartel, are now inevitable.
The headlines and articles, screaming for gold to hit $10,000 to $50,000, are pervasive. Today we won’t dwell on our favorite point that if the price of gold hits $50,000 then that means the price of the dollar has collapsed. If you own an ounce of gold, then you may have a lot more dollars. But unfortunately, each of those dollars is worth a lot less.
Today, we want to look at this new alleged precious metals bull market. Does it have legs? Are we likely to see silver hit $20, much less $1,000? We will support our analysis with a new graph to show the big picture.
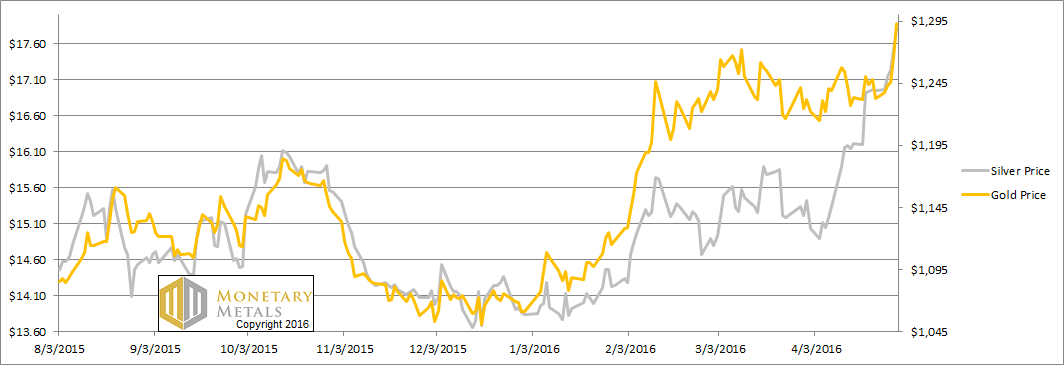
Let’s look at the only true picture of supply and demand fundamentals. But first, here’s the graph of the metals’ prices.
The Prices of Gold and Silver
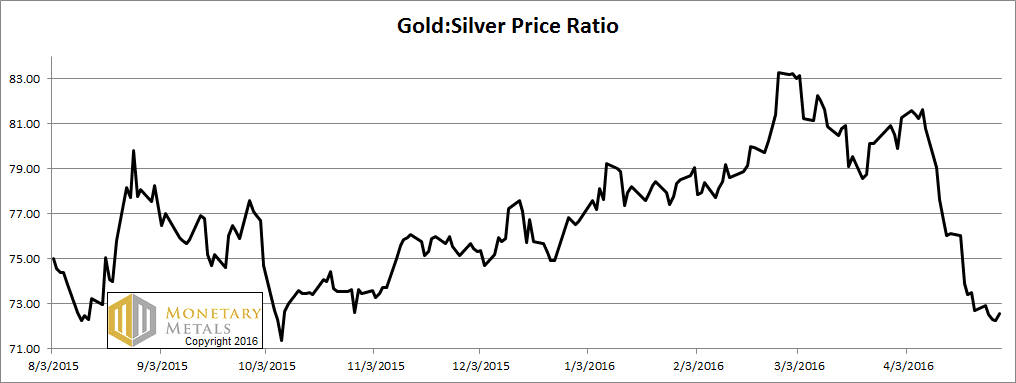
Next, this is a graph of the gold price measured in silver, otherwise known as the gold to silver ratio. The ratio was down slightly this week.
The Ratio of the Gold Price to the Silver Price
For each metal, we will look at a graph of the basis and cobasis overlaid with the price of the dollar in terms of the respective metal. It will make it easier to provide brief commentary. The dollar will be represented in green, the basis in blue and cobasis in red.
Here is the gold graph.
The Gold Basis and Cobasis and the Dollar Price
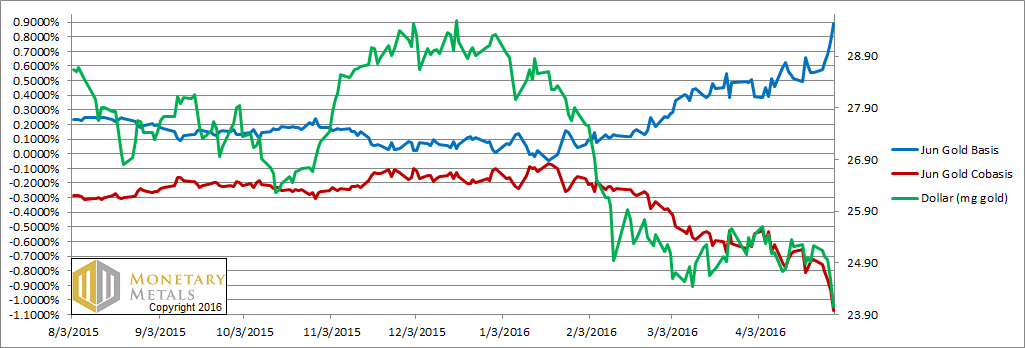
We actually had to expand the range of both axes. The price of the dollar fell off the bottom, currently about 24mg. The cobasis (which is our measure of the scarcity of gold) also fell off the bottom, while the basis (which is our measure of abundance) rose above the top.
As the price of gold continues to rise, it becomes more abundant. Indeed, we can hardly say “scarcity” any more with a cobasis below -1%.
Look, the supply and demand fundamentals could change at any time. However, as of this moment, the picture painted by the basis is not $10,000 or $50,000. It’s more like $1,235. More on this below.
First let’s turn to silver.
The Silver Basis and Cobasis and the Dollar Price
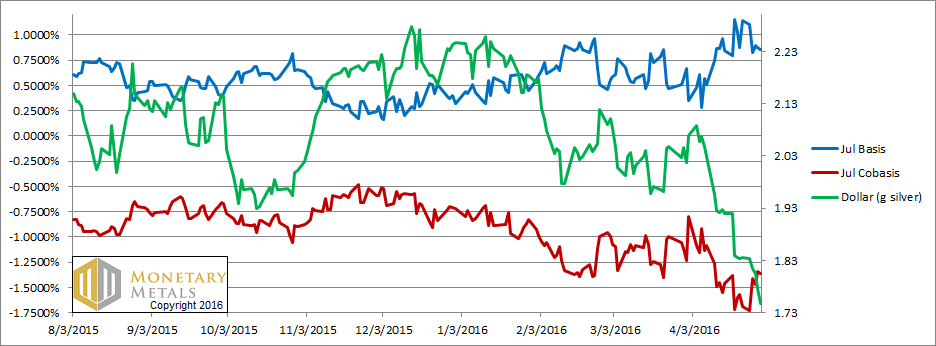
The first thing you’ll notice is that the red cobasis line (i.e. scarcity) has not been falling to match the falling price of the dollar measured in silver (i.e. rising price of silver, measured in dollars) the way it has in the gold chart above. However, two factors mitigate this. One, the silver cobasis is much lower on an absolute basis (no pun intended). In gold, the cobasis is -1.1%, whereas for silver it’s -1.4%.
Two, silver has a much stronger tendency to a falling basis and rising cobasis as each contract nears expiration. In times of greater scarcity, it causes temporary backwardation—each contract tips into backwardation before it goes off the board. This phenomenon begins to distort the silver chart much farther out than in gold, and to a greater (numerical) degree. It has already taken hold in the July silver contract.
This segues into our next chart, a view new to this Report. We show the August and December gold contracts and the September and December silver contracts. Just the basis only, to make the chart easier to read.
The Gold and Silver Basis with LIBOR
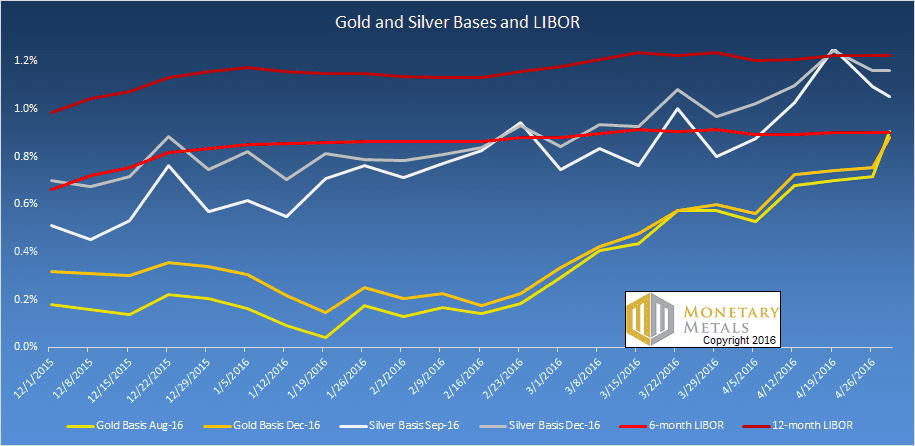
You can see another aspect of our previous point. Even this far out, the silver contracts show more volatility than gold. And the two different months deviate from one another more than in gold.
Note the strong rising trend starting around mid-January.
So what is this showing, really? The basis is the real-world profit you would make to carry metal. Suppose you buy a bar of metal and simultaneously sell a futures contract, storing the metal in the meantime. You pocket the carry spread. If we quote it in terms of dollars, it’s about 14 cents for December silver. We quote it as an annualized percentage, so that you can easily compare it to other investments (more on this in a moment).
The trend for the past few months is that carrying is more and more profitable. What does that tell us? It means that more and more firms will enter the carry trade. A profit attracts people, for some odd reason or another having to do with wanting to make money or something…
Anyways, we know that more market participants are carrying metal because it’s more profitable than it was. Whatever number of people wanted to do it when the profit was 7 cents, we know that more will do it for 14.
What is this telling us about the state of the market for metal? If more and more metal is going into carry trades, then the marginal buyer of metal is this trader who carries metal—whom we often call the warehouseman. The marginal demand for metal is to be carried. This is a dangerous state, because when it flips around, then this marginal demand disappears and then the marginal supply of metal is coming out of carry trades. This is hardly the picture of a shortage driving a durable bull market.
We included two different LIBOR rates on the chart. It’s interesting to compare the basis to LIBOR. Now, in gold, carrying is about the same as 6-month LIBOR. In silver, the return is above that, and at one point got above 12-month LIBOR.
We have one final point. These traders are carrying metal to earn a small spread, with no price exposure. They are arbitragers. The activity of the arbitrageur always causes compression of the spread from which he is profiting. In this case, the carry trade involves buying metal in the spot market and selling it in the futures market. This tends to push up the price of spot metal and pull down the price of futures contracts.
So we have a growing group that’s pushing to compress the basis spread—basis is futures minus spot. Yet the basis is widening despite that. What could cause something to rise, when there’s a powerful and growing force trying to make it fall? What is the even-bigger force at work here?
It is the fast and furious buying of speculators, who bid up futures contracts on leverage. Paper gold is rising, and it’s pulling up gold metal. Paper silver is rising, and it’s pulling up silver metal.
For now.
© 2016 Monetary Metals
Great analysis this week guys. Thanx for that.
And keep hammering us with those definitions of basis and cobasis. ;>
“It is the fast and furious buying of speculators, who bid up futures contracts on leverage. Paper gold is rising, and it’s pulling up gold metal. Paper silver is rising, and it’s pulling up silver metal.”
Having said that (prior comment), I’m thinking now about how the basis and cobasis would look if the metals were pulling up the paper.
Hmm. Your argument seems to imply that those paper traders are bidding up more distance contracts…. bidding up distant contracts fights the widening of the basis, whereas bidding up nearby contracts contribute the widening.
Do I have that correct?
So how does this situation allow for the conclusion that paper is pulling up metal? It would be great if you could do a what-if scenario on how things would look if metal demand was pulling up paper. I for one am not quite there. ;>
Notable in your commentary on this week of rising price in silver without a commensurate fall in the cobasis: you have sought to limit and attenuate the signals emitted by these facts.
1) No comment on the fundamental price of silver. I wonder whether the lack of comment is because that fundamental price (according to your model, which has produced “fundamental” ratios a long way from the actual GSR for a year) is now higher, while that of gold is lower.
True import: bearish the GSR. Your comment: no comment.
2) Direct comparison between the absolute cobases of gold and silver, to make a point slightly in favour of gold. This is despite the fact that the cobasis of gold relative to its average levels over recent months is more than twice its average level, while that of silver is still rather close to it.
True import: bearish the GSR. Your comment: bullish the GSR
My conclusion: the narrative is becoming increasingly detached from the facts.
Nothing here to shift the now rather obvious impression that you are committed for some non-fundamental reason to GSR bullishness.
If so, please disclose.
Update on my position: As mentioned before, a close above 1250 and especially 1260 should lead to a test of the more important resistance between 1305 – 1315. Well here we are. So at 5:53:08am PST I sold June Gold at 1303.20. Silver is re-testing it’s recent high at $18.00 and not looking terribly impressive. But ultimately I have ‘precious’ little evidence to support my bearish speculation.
I will explain later.
Postscript:
Further evidence that the GSR uptrend has failed:
Channel amplitude was 13 GSR points from mid-2011 until late 2014. Starting with a range from 40 to 53 and rising while tightening to a range from 66 to 76 in late 2014. According to this channel slope, the recent peak at 83 should have been at least 85. According to this tightening channel amplitude (bearish rising wedge), the current lows with a 71 handle should be over 76.
After channel support fails, in some cases a retest of the channel lows occurs, allowing the new function of the channel support line as resistance to be clearly seen. Such a rise to the channel support line would now be capped at around 76. Given the downside risks, this is not much to play for.
Generally the ratio will move away from the channel rather hesitantly until it is one full channel amplitude below the previous channel. Currently this level is around a ratio of 67. If the ratio falls significantly below that level the influence of the 2011 to ?2014 channel is completely lost and the ratio finds a new level to the downside. This level will be completely independent of the rising channel. It probably will not be independent of previous GSR lows tolerated by the market in the 35 to 50 range.
Totally agree. If I was to position long the GSR, I’d need 67-68 as incentive. Otherwise, with a 76 target (from 71) there’s not enough upside.
As I sign off, gold is up 4.00 and silver is already negative on the day. Maybe we won’t even get to 70 before silver cracks. But the week is young!
And with the 1305 – 1315 so widely known, I have a hunch we’ll spike above that level (briefly) before it’s all said and done. Just a hunch tho.
It is an interesting setup. History suggests that the GSR should hesitate significantly on the way down – no GSR collapses from major highs on my 30+ year chart ever happened without hanging around somewhere for a few months on the way down. But no GSR collapses ever breached the GSR uptrend in the first three months.
I am watching the SIY00 / SIN16 spread like a hawk. This is probably similar to the metric Keith uses for his “fundamental” (I am not a subscriber). This is not the front month and it should not be tightening as price rises, but it is. Even this week’s MM commentary admits it and shows it on the graph, although the narrative is contrary.
As longer contracts tighten towards cash silver I am not buying the idea that “temporary backwardation” is extending. When you see backwardation you have a choice as to whether to describe it as temporary or not. I would love to know Keith’s true upside target for the GSR and why he still believes in it despite recent events and especially despite the silver cobasis failing to drop commensurately as much as gold’s.
Markets like to take us by surprise. Nothing would surprise us all more (and keep more plebs out of the market) than a journey from 83 to 53 without a major hesitation. I am planning to make a record of the GSR at which MM first emits a clear bearish signal on the GSR; at the bottom (i.e. a year or two later, once it is clear what the bottom was!) we can then see how much of the GSR move was captured by this method of analysis / commentary.
I agree; $1300 for gold and $18 for silver are important technical barriers to confirm a genuine bull market. I would not expect these levels to be exceeded soon; a correction is more likely. The big question for me is how far the correction runs. A modest correction would be healthy and bullish, in my opinion. A severe correction would cast doubt on the durability of the current potential bull market.
The jury is still out; we may be at an important inflection point.
Those who follow my rantings already know I am long term bullish. Big deal. So are most people who open their eyes to the history of fiat money. The more relevant question is how do we invest wisely, which you’ll find has more to do with risk management than anything else.
We are clearly entering a very risky period for the PM markets.
As of April 26th, the amount of speculation (as measured by the COT) was already at a multi-year high: 240,000 contracts. We won’t know until the next report how the BoJ’s announcement affected market positioning… but it’s possible we are now close to the all-time high of 300,000 contracts. If and when gold begins to break down, it will trade progressively lower as those highly leveraged (weak hands) are liquidated. Just don’t forget the keys words — If and when. Until then you must maintain a healthy respect for the uptrend. (Personally I am leaning against these markets at these price levels– more so in silver than gold — but most shouldn’t bother. Trading just happens to be my business)
In term of prices, you’ll want to make special note of the early 2015 highs — which are 1308 gold and 1850 silver. Those levels need to be exceeded on a weekly closing basis to indicate further upside before a short term top. Exceeding those prices on a weekly closing basis would also be the next solid confirmation that gold has conclusively turned the corner, despite whatever correction may come.
At this point I have no opinion on whether those levels will be exceeded. But certain price activity may provide a clue as to what happens next.
For example, a spike to well above $1308 during the first half of this week followed by a failure to end the week above $1308 would be a short-term bearish signal, whereas ending this week above $1308 would suggest that additional upward progress will be made prior to a short-term top.
After recently losing money on the short side, American specs & hedge funds have gotten excited about the long side. As in, over-excited. As in, over-crowded trade. The market will need to slaughter them. If you’re into manipulation theory, OK, then the Powerz (the bullion banks, Fed & China) will need to slaughter them.
Thanks for the comments.
Coastalcruiser: if the metal were pulling up the paper, it would be backwardation. We would have a negative basis and positive cobasis. I am not so much saying that paper traders are bidding up more distant contracts, as I am saying that nearer contracts (especially in silver) get distorted. Sometimes it’s useful to take a step back and look at the bigger picture.
Ratio: you’re on to me. My committment to a rising GSR is because I am paid by the car—-aaaahhhhh! Wish I could say more but they said they would–mmmfff!
OK, in all seriousness, yes we publish the data so people can see it for themselves. And we provide commentary. Readers are obviously free to agree or disagree with the commentary. As of Friday, we have a fundamental price of silver of $15.60 and a fundamental on the GSR over 79. Bearish the ratio? Not yet. We’re looking for more than this, and let’s not lose perspective that the absolute level of the silver basis is higher especially once you get outside the distortion of the near contracts. And even in the near contract, the silver cobasis is substantially lower.
I say it every once in a while, and it bears stating again. The basis is not a daily trading signal much less daily price target. There is volatility in the basis which may be just noise, and especially in silver there are short-term moves that just dissipate. We shall see on this one.
To clarify one thing, there is no backwardation right now. I coined the term temporary backwardation to denote the near contract (and maybe the next one or two) going into backwardation. It’s temporary because the contract then moves off the board.
Best success in your trading.
Keith
Thanks for your comment, which was worth a proper lol. I could just see the pillow over your face. My suspicion was however not political pressure, just confirmation bias. Silver has been a dog for a while and you have been kicking it for a while. Will you stop in time?
Your ratio and fundamental silver are as I suspected. My concern is that the metrics will continue to shout out “it should not be falling” while it collapses. GSR moves fast so perhaps IF the “fast phase” of GSR decline occurs right at the beginning, your analysis tool just cannot capture it.
If as previously we get the ratio hanging round at 75 for 6 months and you start talking about a fundamental in the 60s, then you have caught it. I do not know which will happen, but since we may wait 6 years for the next big GSR fall, it is not an insignificant detail. Anyway, thanks for explaining.
Normally the silver contango will always be greater than gold. Comex warrants storage costs are much higher, $45 per contract per month versus $15. In addition, one silver contract is less than $90,000 versus $129,000 for gold. It is much more expensive to be a silver warehouse-man resulting in usually a substantially higher contango.
Keith is right; watch the contango for clues. I suggest you also watch the net contango, net of storage costs.
Obviously this is true; it is reflected in the lower baseline cobasis for silver which makes comparison of the absolute cobasis levels so glaringly misleading. Thanks for pointing it out. It is not necessary to crunch the numbers to see that gold is horribly loose and silver relatively tight despite 12 points in the GSR. That does not guarantee a continuation though; moves can dissipate as Keith said.
The precious metals are clearly overbought; I agree with Keith. Nimble traders may want to lighten up long positions or take a temporary short position.
Personally I’m remaining as long as ever platinum, my favorite precious metal as explained in previous posts. (I’m more greedy than I am nimble)
If the markets correct as I suggest above, the size of the correction will be instructive. A relatively large downdraft will confirm Keith’s contango centered view of the gold and silver markets. Alternatively, a modest correction will help to confirm a more durable bull market.
Thanx for the reply Keith. And thanx to the other insightful commenters as well.
Keith: Thank you for the beautiful Aurum. I hope to be able to reciprocate your kind gift. Cheers.
Based on traditional momentum indicators, the PM’s are NOT overbought. Not by a long stretch.
Those who would disagree, I ask you: are the weekly RSI (or even the daily) indicators overbought in any way? Didn’t think so. In an overbot market those things would be well into the 70’s, if not the the high 70’s or low 80’s with divergences. Other momentum metrics are nearly identical.
I think what bothers all of us is the relentless blast off the bottom… and that many missed it.
I would admit this much: These markets are over-extended in terms of participation and sentiment, but those are among the least reliable indicators on record. Without supporting evidence they’re virtually worthless.
Be careful out there.
Good post bbartlow, thanks. Parabolic price increases scare me. Yet, as you earlier opined, IF this is a genuine bull market, it is a very young one. I’m ready to ride the potential bull, in fact, I continue to buy on pullbacks. I was in too soon, trying to catch the falling knife. Now, I’ll likely be out too late, trying to decapitate the last bear. Oh well, I believe in the George Soros / Stanley Druckenmiller theory of speculation, most all of your profits are made by a few timely grand slam home run trades.
I agree, being careful is prudent. Yet, when the bulls are running, it may be time to run with them. I’m NOT a trend follower by nature; I’m a contrarian. Yet, if the fundamentals are strong (which may be the case with PM’s in a ZIRP and NIRP reserve currency world), once the trend starts it can be powerful and long lasting.
Druckenmiller is one of my faves; and a very nice man too. He had a series of interviews back in 2011 you won’t want to miss.
Here’s a more recent talk; start at the 18:00 minute mark if you’re not interested in stocks. In fact, watch it twice and take notes. Fantastic data on demographics…. a small glimpse of what he spoke of extensively during his 2011 Tour.
https://www.youtube.com/watch?v=aviToCACiNA
By the way, I said ‘be careful’ since i know many of us are bearish here, sensing too many bulls and not wanting to be trapped during a painful correction. Despite that, I believe this developing top may not be that easy to trade. In fact, if this consolidation is like the others, all we’ll get is a slight pullback, a period of rest and choppiness, then the next surge.
I should also mention: It doesn’t bother me that futures are leading the way. To me that’s just a way of life. Futures lead. Especially when supported by similar movements in equities and bonds. Cash markets figure it out eventually. The arbs are all working to knock down that tasty (but still measly) 1%…. meanwhile something momentus is happening: gold is removing its bid on the reserve currency of the wealthiest country on earth. Eventually this might even be front page news, ya think! /sarc
But seriously, the pressures that are building up in the system are profound. Most fiat currencies last about 35 yrs. This one is already 45 yrs. old. So don’t be surprised if you see King Dollar on it’s death bed within 10 yrs.
Because of that, I believe we’ll be seeing some numbers (in a variety of areas) that will make no sense to us, and it’s because we’re in completely unchartered territory. We should start expecting the unexpected. You know, it’s not everyday the biggest country on earth — along with its currency — gets taken out and shot. The last time this happened was the Roman Empire. Literally. Rome itself went from having millions of people to only 1000. There was no money… so there was no food… so there was no life there. To survive you had to move out just to have a chance. And it all started with their corruption in politics and money, just like us. Here’s one for ya! http://screencast.com/t/0EDrNsMSWx
Then look up the population stats during that same period.
Anyway, getting back to gold. If you’re interested in the very short term in the current environment, keep an eye on the Yen (up 6 handles?!)… and try to figure out whether the BoJ is trying to destroy Kyle Bass, or just how much unwinding of that massive Yen carry trade will be taken off. The weak dollar has clearly helped gold. It’s hard to see it surmounting critical resistance at 1308 without major impetus. The Yen could provide it… or not.
Incidentally, Central banks have never liked big hedge funds making money on CB manipulation. Go figure, huh?
To a lesser extent, I would also watch the primaries. Trump or Clinton would be more of the same: spend mind-boggling sums of money and blame Congress or something else… like a war. Reminds me, Grant Williams — great vid on our prospects for war. Think it’s called “consequences of the peace”… Youtube or his private website. Very pro gold and worth watching.
Trump, for his part, has proven very aggressive with money and loves leverage. I see him as gold bullish. However, should the fiscal conservative Cruz make a legitimate turnaround and win the nomination, I can’t help but think gold has limited upside for a while. The market would go from expecting inflation to expecting deflation almost overnight. In other words, they would see Cruz as a Hoover, when in fact he might be a Harding.
Either way, gold could lose in that environment… unless a return to the gold standard gains traction.
In every instance, however, we always need to be looking ahead. Look ahead to next year and the year beyond even… because that’s what markets are doing.
Because it’s true: “Markets are a discounting mechanism.”
Thanks again bbartlow, an excellent post, wide ranging and realistic.
I confess to smiling as the Yen carry traders get slaughtered, even though the investment committee I sit on owns a dumb-ass currency speculation fund masquerading as a bond fund. I was the lone dissenter. The others scoffed when I suggested platinum, way too unconventional, borderline goofy. It’s the old story, much safer to be wrong in good company than risk being wrong alone. Why do these “professionals” get paid so well for parroting well-worn investment ideas so popular with the crowd?
I always enjoy reading contrary opinion, for example David Stockman, who predicts intensifying commodity weakness and deflation based on peak debt. He is thoughtful, backs up his opinions with relevant statistics, and is generally persuasive. I thoroughly enjoy debate and contrary opinion, especially re investing and politics.
Politicians seem to resist structural changes until dire circumstances force their hand. What will be the result of prolonged ZIRP and NIRP, eventual inflation, or pushing on a string? Will a political consensus develop for aggressive fiscal policy? What about helicopter money; Janet & Ben seem fixated on more inflation to help debtors, especially Uncle Sam?
Cruz has almost zero chance of being our next President, in my opinion; here I stand with the crowd and pundits.
I’m not bullish on U.S. equities, not bullish on debt securities, commercial real estate is expensive, where to put one’s money? I don’t have time to research individual securities. I wish I had a good answer; but I don’t.
Although you didn’t state it directly Keith, it seems like an underlying message is that the Dollar in on shaky ground. I suppose most currencies are these days. I often read that the Dollar only appears to rise against other currencies because in is falling a little slower.
I picture that gold has mass and the dollar simply orbits gold in decaying pattern, eventually doomed to crash on the surface, with zero value. History seems to offer convincing evidence of the Dollar’s eventual demise. We often hear (or say) “I remember when a dollar would buy….”
The IRS is quick to take advantage of this. For example, let’s say, you bought a house in 1980 for 80,000 USD and sold it in 2016 for 220,000. The value of the Dollars you receive in 2016, are approximately the same as the 1980 Dollars. That doesn’t matter to the IRS. You will still have to pay capital gains tax on the “140,000 net gain” even though you didn’t actually profit on the deal.
Your argument that gold and sliver are actual money seems sound, Keith. It is only the peaks and valleys in the Dollar’s ratio to gold, that can offer any advantage in buying gold at a good price.