
Possible Sign of Silver Turn, Report 31 Jan, 2016
The price of the dollar was down 50mg gold, to 27.8mg, or if you prefer 0.04g silver to 2.18g. Why do we measure the volatile dollar in terms of gold and silver? There’s nothing else to measure it, certainly not the dollar-derivatives called euro, pound, franc, yen, and yuan.
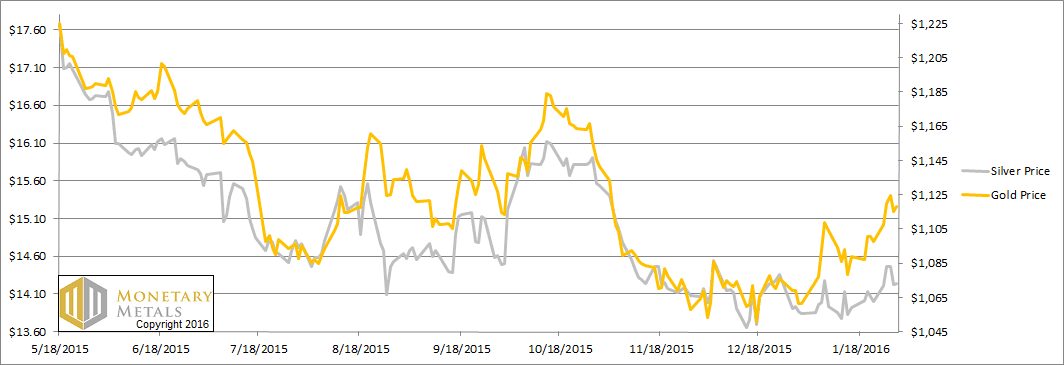
In the common tongue, gold was up $20 and silver rose 25 cents.
More importantly, we want to know what happened to the fundamentals. Read on for the only proper fundamental analysis of the gold and silver markets…
But first, here’s the graph of the metals’ prices.
The Prices of Gold and Silver
We are interested in the changing equilibrium created when some market participants are accumulating hoards and others are dishoarding. Of course, what makes it exciting is that speculators can (temporarily) exaggerate or fight against the trend. The speculators are often acting on rumors, technical analysis, or partial data about flows into or out of one corner of the market. That kind of information can’t tell them whether the globe, on net, is hoarding or dishoarding.
One could point out that gold does not, on net, go into or out of anything. Yes, that is true. But it can come out of hoards and into carry trades. That is what we study. The gold basis tells us about this dynamic.
Conventional techniques for analyzing supply and demand are inapplicable to gold and silver, because the monetary metals have such high inventories. In normal commodities, inventories divided by annual production (stocks to flows) can be measured in months. The world just does not keep much inventory in wheat or oil.
With gold and silver, stocks to flows is measured in decades. Every ounce of those massive stockpiles is potential supply. Everyone on the planet is potential demand. At the right price, and under the right conditions. Looking at incremental changes in mine output or electronic manufacturing is not helpful to predict the future prices of the metals. For an introduction and guide to our concepts and theory, click here.
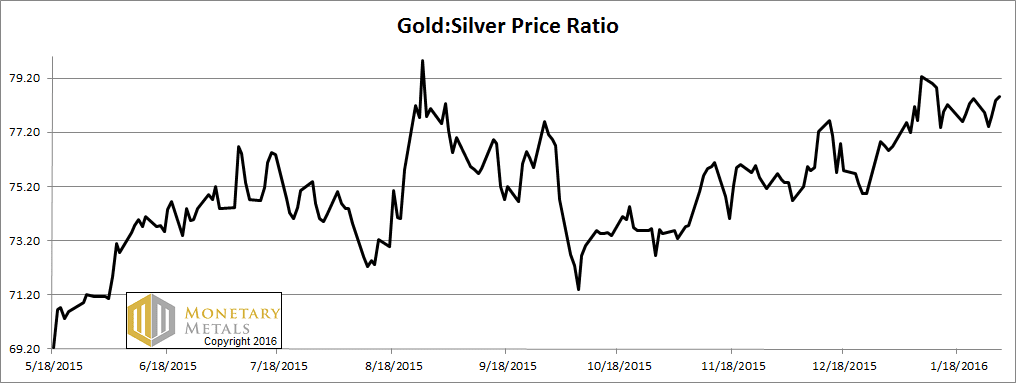
Next, this is a graph of the gold price measured in silver, otherwise known as the gold to silver ratio. The ratio went sideways this week.
The Ratio of the Gold Price to the Silver Price
For each metal, we will look at a graph of the basis and cobasis overlaid with the price of the dollar in terms of the respective metal. It will make it easier to provide brief commentary. The dollar will be represented in green, the basis in blue and cobasis in red.
Here is the gold graph.
The Gold Basis and Cobasis and the Dollar Price
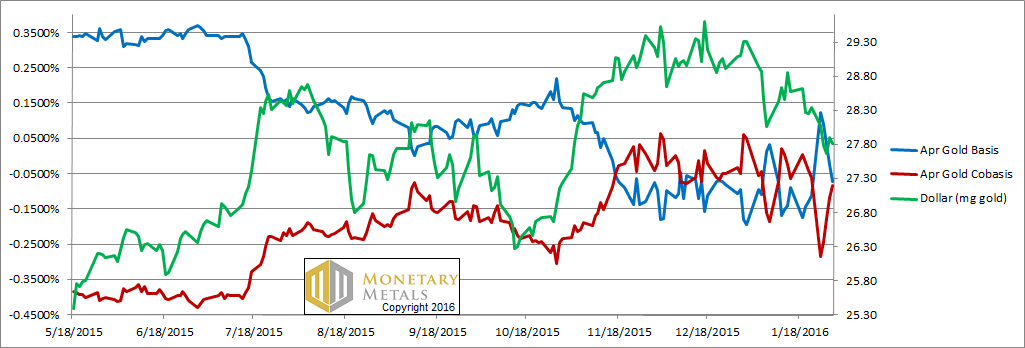
The cobasis (i.e. scarcity) moved around and ended pretty close to where it started. What’s notable is that this occurred when the price of gold was rising. What you can’t see on this chart, is that in farther contract months the cobasis fell a bit more.
The fundamental price of gold didn’t move much this week. In other words, speculators pushed up the price but the fundamentals are holding.
Now let’s look at silver.
The Silver Basis and Cobasis and the Dollar Price
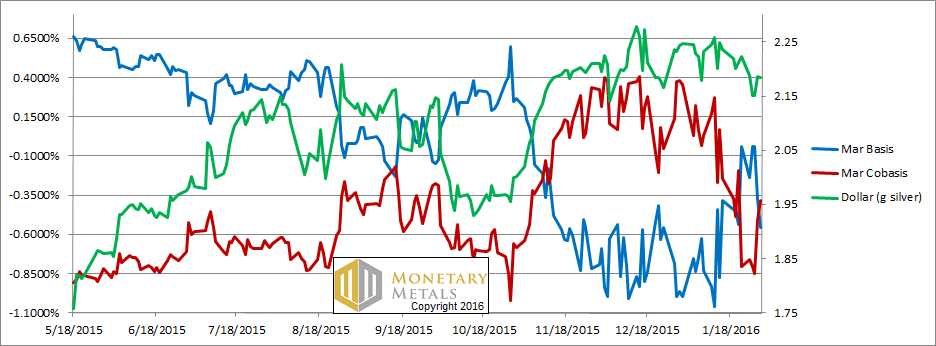
In silver, you can see that as the price of the dollar fell (i.e. the price of silver rose) in the first part of the week, the cobasis went sideways to down. But in the last part of the week, the cobasis shot up while the price of silver fell a little.
It’s far too early to call a bottom in the silver price. However, the movement on Thu and Fri is the sort of action we should expect to see more of if silver is to return to a bull market. It will take more action like this before we change our position on the white metal, but it is worth reporting on what we see when we see it.
Our calculated fundamental price of silver rose 35 cents, to basically at the market price.
We plan to drill down into the extraordinary move in the silver price around Thursday’s silver fix. Look for our article this week.
© 2016 Monetary Metals
Hi Keith
Do you think your silver basis and cobasis graph would look different if the
contact specification was for 5000 silver eagles (BU condition) instead of a 5000 ounce bar ?
Would it not make the scarcity more pronounced ?
Jim
jmf: No doubt. The premium on silver Eagles was massive (I don’t have current data in front of me). At its peak, the cobasis would have been 100% or more (vs. tens of basis points typically). But what is that measuring?
Silver shortage generally? Or inelastic supply chain (especially blanks) in coins…?
Could it be measuring what a few traders in 400 or 5000 oz bars with a legal monopoly claim is fiat value versus what millions of coin carriers viscerally feel? This market is the only official place (abstractedly) on earth where fiat exchange value is determined. Coin carriers have no say. Without it there would be no gold or silver “price”. They would be money and these markets would be an unpleasant memory.
Coin manufacturing capacity, especially as I understand it blank manufacturing, is inelastic. So when demand rises above this capacity there can be acute shortages in coins. This causes the premium on coins to rise massively.
It does not mean that silver metal is scarce. Rather that the coin supply chain can’t meet demand at the moment.
What if the silver contract specification was for a very portable, Joe public friendly, 100 ounce bar (same weight as the gold contract) instead of the 5000 ounce bar ?
Would this not make the scarcity greater ?
Either the metal is available to the market, or not. Either owners are willing to keep it in play for profit, or they are taking their marbles out of the sandbox and going home.
The issue with coins is blank and perhaps other manufacturing capacity. Capacity is inelastic. So if there’s a spike in coin demand, premiums could go through the roof. It does not mean that silver *metal* as such is unavailable.
100oz bars may or may not have manufacturing capacity constraints. If not, the would show nothing different than do 1000 oz bars.
Demand for bars is that they become coins. Coins for commerce is precluded by the bar auction paper rule and the cops so they tend to go into the mattress. The flow becoming coins is small compared to coins already in the mattress.
Gold out of backwardation around January 21 as per this report.
CME Gold in warehouses on January 21:
Total Registered: 275,425 oz.
Total Eligible: 6,125,955 oz.
Grand Total: 6,401,380 oz.
Numbers as most recent report (July 8 activity)
Total Registered: 1,479,207 oz. (+ 1,203,782 oz.)
Total Eligible: 8,060,765 oz. (+ 1,934,810 oz.)
Grand Total: 9,539,972 oz. (+ 3,138,592 oz.
Silvery out of backwardation around 9 days earlier than gold (approx January 12)
CME Silver in warehouses on January 12:
Total Registered: 36,148,230 oz.
Total Eligible: 119,208,400 oz.
Grand Total: 155,356,630 oz.
Numbers as most recent report (July 8 activity)
Total Registered: 25,061,061 oz. ( – 11,087,169 oz.)
Total Eligible: 125,731,420 oz. ( + 6,523,020 oz.)
Grand Total: 150,792,482 oz. ( – 4,564,148 oz.)