
About Monetary Metals’ Gold & Silver Forward Offered Rates
The Monetary Metals® forward offered rates for gold (MM GOFO™) and silver (MM SIFO™) are market-derived measures of the rate at which dealers would theoretically lend gold or silver on a swap basis against US dollars.
These rates are the foundation for the pricing of gold swaps, forwards, and leases and are important to mining companies, refiners, jewelers, and other users of gold. The London Bullion Market Association (LBMA) quoted GOFO and SIFO every day since the 1980’s, but stopped quoting SIFO in November 2012 due to a lack of reliable quotes and GOFO in January 2015 due to new regulations following the London Interbank Offered Rate (LIBOR) manipulation scandal.
When the LBMA announced that it was scrapping its GOFO rates, Ross Norman of Sharps Pixley lamented that it was “yet another step in making important gold information opaque.” Notwithstanding the need for the rates, accurate forward rates using public price data has never been calculated, with noted gold industry veteran James Turk saying that “there is no way to create a GOFO for public consumption.”
To help empower gold users and bring transparency back to the market, Monetary Metals® developed unconventional proprietary techniques to calculate indicative inter-bank wholesale 6 month and 12 month forward rates (both bid and offer) as well as derived lease rates using LIBOR—and makes them available free of charge to the industry. Note that these are indicative wholesale rates only and actual rates charged for borrowing, or paid on deposits, will depend on bank profit margins, client credit risk and other factors. For actual rates paid to investors on Monetary Metal’s leases, see our Funded Leases & Bonds page. See below for more information on Monetary Metals’ calculation technique.
Comparison to LBMA Rates
The table below shows the correlations between Monetary Metals’ and LBMA’s forward rates. The LBMA began quoting GOFO in July 17, 1989 and ceased on January 30, 2015. However, the data we licensed from Thomson Reuters goes back to January 1, 1996. So the overlap of MM GOFO™ and LBMA GOFO can be observed from the start of our data until the end of the LBMA data, or 19 years. The silver correlations are for the period July 26, 1999 to November 2, 2012, when LBMA SIFO ceased to be quoted (just over 13 years).
| Duration | Gold | Silver |
| 6 Month | 0.9910 | 0.9199 |
| 12 Month | 0.9950 | 0.9152 |
The GOFO correlations are exceptionally high, over a long period. The SIFO correlations are lower, due to silver’s lower liquidity and market depth. The Monetary Metals GOFO and SIFO correlate with LBMA GOFO and SIFO, but don’t match exactly for a number of reasons.
First, LBMA’s rates are based on spot and future/forward prices for metal loco London, whereas Monetary Metals’ rates are based on loco London spot and Comex futures (loco New York). The difference in location introduces potential for shipment costs if marginal arbitraguers could not offset their positions in London and New York and thus required settlement.
Second, for gold, in such a situation where the Comex futures contract had to be taken to expiry, the physical settlement would be in 100oz bars loco New York versus 400oz bars loco London, introducing transformation costs (this is not a factor for silver as both markets settle in 1000oz bars).
Monetary Metals® has not attempted to factor in the shipment, financing or transformation costs to quantify the loco swap premium/discount or exchange for physical pricing into its rates. Our view is that apart from the difficulty of obtaining any reliable historical source for such data, that for the most part these costs are not material, as evidenced by how close our rates are to LBMA’s over many time periods.
Third, as our rates are derived from exchange traded futures contracts, periods of very low liquidity can result in calculated rates being suspect, which shows up as spikes or variability in the rate. Where there is insufficient data we are unable to calculate rates and these show up as gaps in the charts. We aren’t infallible so we may miss errors in the source data or our algorithms may not have considered all corner cases. We are constantly refining our data processing systems and welcome your feeback.
We want everyone to understand that the MM GOFO™ and MM SIFO™ rates are indicative only. LBMA’s GOFO was used as a benchmark for contact settlements (SIFO was only an indicative rate and not recommened for transaction settlement) but in retrospect as they were based on the same compromised process as LIBOR doubts may be raised as to whether GOFO was an absolute executable rate – actual rates charged to clients would vary depending on client specific factors and one’s negotiating skill and power. Arguably the industry used the LBMA’s rates not so much to tell them what they would pay but for a sense of where the market was and its direction. The high correlation of Monetary Metal’s rates to the LBMA’s means that the industry can again have a reference point for forward and lease rates.
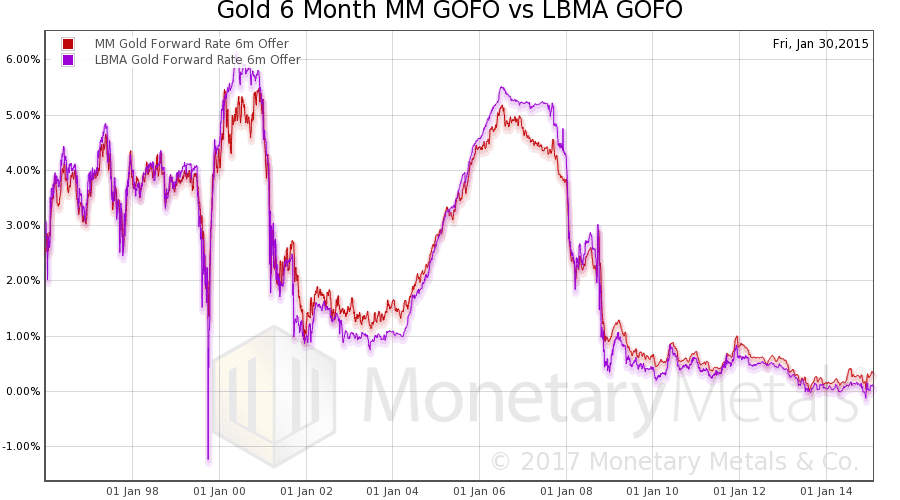
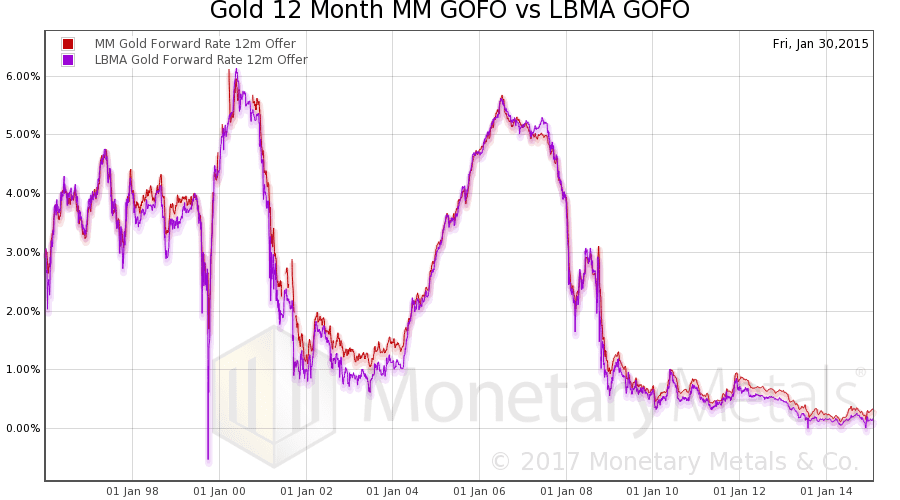
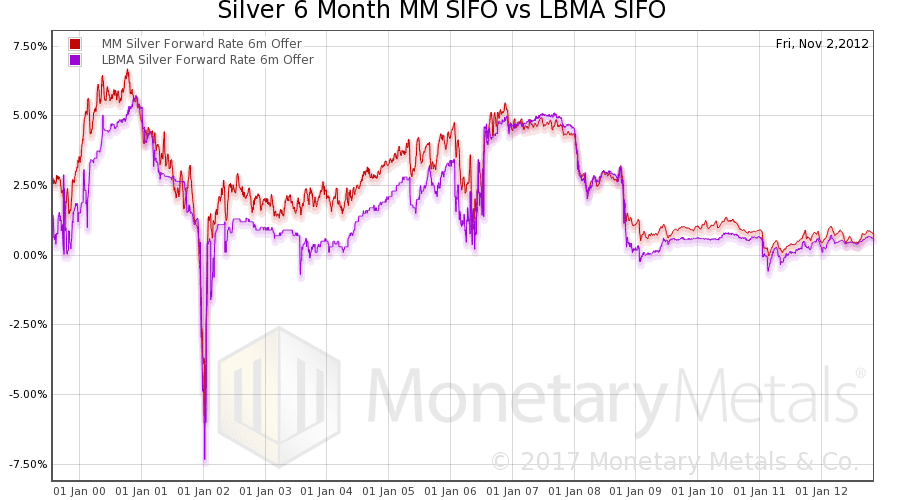
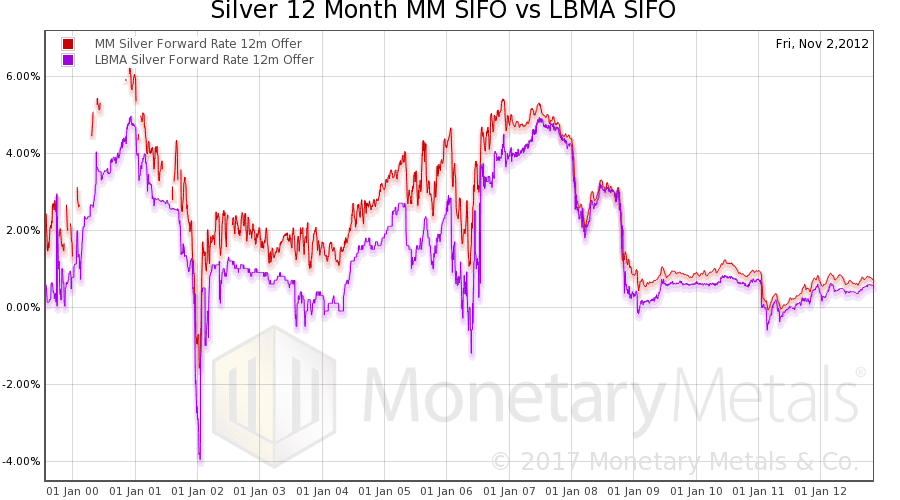
The charts below give a visual comparison of Monetary Metals’ forward rates with those published by the LBMA.
Gold 6 Month MM GOFO™ vs LBMA GOFO
Gold 12 Month MM GOFO™ vs LBMA GOFO
Silver 6 Month MM SIFO™ vs LBMA SIFO
Silver 12 Month MM SIFO™ vs LBMA SIFO
The LBMA described GOFO as the “rate at which contributors were prepared to lend gold to each other on a swap basis against US dollars.” In other words, they are saying Party A gives gold to Party B and gets dollars in exchange. It’s a swap, so at maturity the parties return the gold and dollars to their original owners.
Therefore, GOFO is the interest rate differential between dollars (i.e., LIBOR) and gold (i.e., the calculated Gold Lease Rate). GOFO = LIBOR – GLR. There is a lot more to be said on this relationship, and we wrote a three-part series on it (Part I, Part II, and Part III).
For purposes of our discussion here, it suffices to say that GOFO is simply the (dollar) yield between spot and a contract for future delivery. GOFO is a curve that, like the government bond interest rate, generally slopes upward as maturities increase.
One might naively think to calculate GOFO by finding price data for spot and futures. For example, one can easily find end-of-day quotes on the Internet. Subtract Future – Spot. That’s the raw profit. Then divide by spot to get a fraction, which is the gross return. Then annualize it by multiplying by 12 and dividing by whatever months remain in that contract.
For example, the December 2016 gold contract closed on June 30 at $1327.40, minus spot gold which closed at $1321.49 = $5.91. Divide by $1321.49, to get 0.45% return. But this is for about six months, so the annual percentage is double, or 0.89%.
Is that the 6 month GOFO?
It’s not a totally terrible first approximation. But it’s not accurate either. For comparison, we calculate the 6 month GOFO at 1.4491% for June 30, 2016.
There are two immediate problems with this approach. First, to say “Future – Spot” means buying spot at the asked or offered price, and selling the February contract on the bid price. It is not so simple as Future – Spot. It is actually Future(bid) – Spot(offer). We don’t know whether $1321.49 represented the spot offer price, or whether $1327.40 was the futures bid.
Second, there may be less liquidity at the end of the day. Whatever the bid and offer prices might be, the bid/offer spread will be wider at the end of the day than during normal trading hours. Wider spreads cause our calculated forward rate to be lower than it should be (it’s just how the arithmetic works). Closing prices also represent last traded prices, not bid or offer. Using settlement prices suffers from the same problem, and these are calculated using a multi-layered formula.
Assuming we could get bid and offer prices, then there are three additional problems. First, you have to make sure your sample does not occur at the moment when buying or selling pressure is momentarily impacting either spot or futures. This could distort the calculation significantly. You need software to look at many data points.
Second, what do you do on July 29 if you are using the December 2016 gold contract? Your 6 month GOFO is now degraded to 5 months. GOFO is supposed to be a constant maturity quote unlike COMEX futures which are discrete.
Third, the bid on each contract tends to fall once the contract begins to approach expiration, as there is unbalanced selling pressure on that contract. The rolling of positions into the next contract also introduces a lot of noise into the price. The time when the roll begins can vary (and it occurs earlier in silver than in gold), but it creates more problems for calculating an accurate GOFO.
There are many other subtle problems. For example, quotes for spot are coming from individual banks. These can occur out of order, such that a lower bid or higher offer would seem to replace a better bid or offer.
One needs software to address these issues. And it will have to crunch a lot of data. The raw data to produce our MM GOFO™ and MM SIFO™ charts is over two terabytes.
While we are going to keep the details proprietary, we are happy to discuss the general approach and theory of operations of the software we built to calculate GOFO. Let’s start by going through the list of problems above.
The solution to the first three problems is to obtain real-time tick data, or for historical GOFO, tick history data. Monetary Metals® licensed a database that goes back to 1996, from Thomson Reuters. This provides time-stamped bid and offer prices for both spot and futures markets, for the entire trading day. Futures contracts are listed for at least 18 months out of each day (expiring ones are periodically disappearing while new ones are added).
It is not sufficient to look at only one contract. As noted above, there are two problems with just using the near contract. It tends to fall as it approaches expiry, and its duration is falling every day.
Our software therefore looks at forward spreads for all contracts. From these discrete spreads, it calculates a single continuous constant-maturity forward spread. The most important attribute is that the duration every day is constant. This takes out the falling bias as each contract approaches expiry. It also makes a more useful indicator, and a major step closer to a proper GOFO.
As noted above, to get a reliable and consistent measurement, it is necessary to gather data in a time window. Any single point could be anomalous, and there is no way to recognize that, without seeing it in the context of many other data points.
And how big should the window be? Too small and it loses the context that we just discussed. But if it’s too long, there can be significant changes in market conditions. And then what do you do with a buffer full of calculations? You can’t just take the average. We will keep the answers to these two questions proprietary.
Finally, the spot market works differently than futures. While COMEX provides a best bid and best offer, the spot market is not cleared through a single server. Each bank provides its own stream of quotes, and later quotes from Bank B do not necessarily replace earlier quotes from Bank A.
In other words, real world data is noisy. It contains glitches, and reflects temporary or even ephemeral conditions in the real world as well as entirely spurious noise. It has to be filtered. The problem with filtering is that one risks creating an artificial picture that’s unnaturally smooth, suppressing real and important features in the signal.
Instead of heavy filtering, we drilled down and looked at each corner case (to use the lingo of programmers). The software recognizes each instance, for example, the one just discussed where a bank sends a quote worse than the previous quote, and make the appropriate adjustment. The result of identifying all of the corner cases and coding for them is that only minimal conventional filtering is required. The full information content of the signal is preserved.
If you have questions about our methodology, please leave a comment on our Chart Chat page.