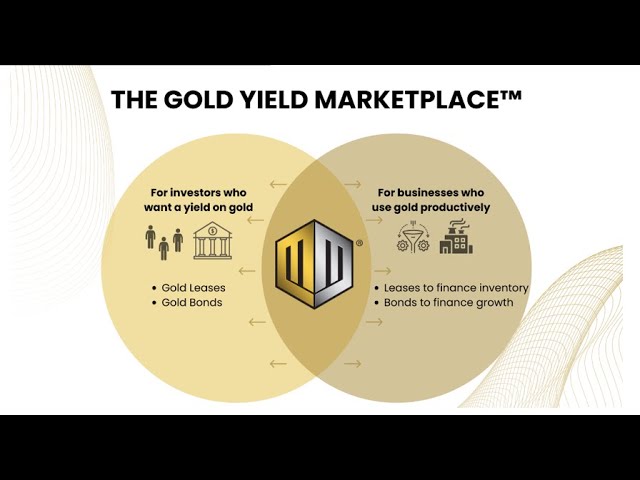
| Monetary Metals & Co. LinkedIn Profile | https://www.linkedin.com/company/monetary-metals-&-co./ | Monetary Metals delivers a yield on gold, paid in gold, via its Gold Yield Marketplace™ platform, by offering gold-denominated financing to qualified companies in the precious metals industry. Through its gold leases and gold bonds, investors and institutions worldwide earn a yield on gold and silver every month, compounding their holdings over time with no storage fees. For more information, please visit monetary-metals.com. Founded in 2012 and headquartered in Scottsdale, Arizona, Monetary Metals is a different kind of gold company. Unlike others that simply buy or sell gold for dollar price appreciation, Monetary Metals unlocks the productivity of gold by matching investors who hold gold and silver with qualified precious metals businesses who need financing, including mints, refiners, jewelry manufacturers, miners, and recyclers. The businesses benefit from financing denominated in metal—which removes the need to hedge their price exposure—and owners of gold and silver can benefit from growing their total ounces of metal. The company offers two primary gold fixed income products: gold leases and gold bonds (gold bonds are for accredited investors only), which deliver income paid in physical ounces rather than dollars, eliminating storage fees and enabling investors to achieve compounding returns in ounces gained rather than mere dollar price appreciation. Since launching the Gold Yield Marketplace™ in 2016, the company has completed over 80 funded transactions across six continents. Monetary Metals has served thousands of clients—including family offices, high net worth individuals, and institutional investors— with the vision that everyone can save, earn and finance production in gold. |
| Monetary Metals & Co. X (Twitter) Profile | https://twitter.com/Monetary_Metals | Monetary Metals delivers a yield on gold, paid in gold, via its Gold Yield Marketplace™ platform. |
| Monetary Metals & Co. Facebook Profile | https://www.facebook.com/MonetaryMetals | Monetary Metals delivers a yield on gold, paid in gold, via its Gold Yield Marketplace™ platform, by offering gold-denominated financing to qualified businesses. |
| Monetary Metals & Co. YouTube Channel | https://www.youtube.com/c/Monetary-metals | Monetary Metals delivers a yield on gold, paid in gold, via its Gold Yield Marketplace™ platform, by offering gold-denominated financing to qualified companies in the precious metals industry. Through its gold leases and gold bonds, investors and institutions worldwide earn a yield on gold and silver every month, compounding their holdings over time with no storage fees. |
| Monetary Metals & Co. UAE Website | https://www.monetary-metals.ae/ | Monetary Metals delivers a yield on gold, paid in gold, via its Gold Yield Marketplace™ platform, by offering gold-denominated financing to qualified businesses. |
| Monetary Metals & Co. Inc. Profile | https://www.inc.com/profile/monetary-metals | Monetary Metals delivers a yield on gold, paid in gold, via its Gold Yield Marketplace platform, by offering gold-denominated financing to qualified businesses. |
| Monetary Metals & Co. Pitch Book Profile | https://pitchbook.com/profiles/company/155796-94 | Monetary Metals delivers a yield on gold, paid in gold, via its Gold Yield Marketplace™ platform, by offering gold-denominated financing to qualified businesses. |
| Monetary Metals & Co. Tracxn Profile | https://tracxn.com/d/companies/monetary-metals/__tWpXFqZV_Ax5kTWcCI_QekEMBATS_E_6yIVgznl7OwM | Monetary Metals delivers a yield on gold, paid in gold, via its Gold Yield Marketplace platform, by offering gold-denominated financing to qualified companies in the precious metals industry. |
| Monetary Metals & Co. Better Business Bureau (BBB) Profile | https://www.bbb.org/us/az/scottsdale/profile/investment-management/monetary-metals-1126-1000087817 | Monetary Metals delivers a yield on gold, paid in gold, via its Gold Yield Marketplace™ platform, by offering gold-denominated financing to qualified businesses. |
| Monetary Metals & Co. Crunchbase Profile | https://www.crunchbase.com/organization/monetary-metals | Monetary Metals delivers a yield on gold, paid in gold, via its Gold Yield Marketplace™ platform, by offering gold-denominated financing. |
| Monetary Metals Google Patents Profile | https://patents.google.com/?assignee=Monetary+Metals+%26+Co | Google patents profile for Monetary Metals as an assignee |
| Monetary Metals Google Business KGMID | https://www.google.com/search?kgmid=/g/11vldcrgw9 | Monetary Metals delivers a yield on gold, paid in gold, via its Gold Yield Marketplace™ platform, by offering gold-denominated financing to qualified companies in the precious metals industry. Through its gold leases and gold bonds, investors and institutions worldwide earn a yield on gold and silver every month, compounding their holdings over time with no storage fees. |
| Monetary Metals alternative name (Monetary Metals Corp) KGMID | https://www.google.com/search?kgmid=/g/11f01bkd18 | The KGMID associated with Monetary Metals Corp, an alternative name for Monetary Metals & Co. |
| Monetary Metals & Co. Trustpilot profile | https://www.trustpilot.com/review/monetary-metals.com | Monetary Metals delivers a yield on gold, paid in gold, via its Gold Yield Marketplace™ platform, by offering gold-denominated financing to qualified businesses. |
| Monetary Metals & Co. Bloomberg company profile | https://www.bloomberg.com/profile/company/1627759D:US | Monetary Metals & Co. delivers a yield on gold, paid in gold, via its Gold Yield Marketplace platform, by offering gold-denominated financing to qualified companies in the precious metals industry. Through its gold leases and gold bonds, investors and institutions worldwide earn a yield on gold and silver every month, compounding overtime with no storage fees. |
| Monetary Metals & Co. bitscale.ai profile | https://bitscale.ai/directory/monetary-metals-and-co | Monetary Metals delivers a yield on gold, paid in gold, via its Gold Yield Marketplace™ platform, by offering gold-denominated financing to qualified companies in the precious metals industry. Through its gold leases and gold bonds, investors and institutions worldwide earn a yield on gold and silver every month, compounding their holdings over time with no storage fees. For more information, please visit monetary-metals.com.
Founded in 2012 and headquartered in Scottsdale, Arizona, Monetary Metals is a different kind of gold company. Unlike others that simply buy or sell gold for dollar price appreciation, Monetary Metals unlocks the productivity of gold by matching investors who hold gold and silver with qualified precious metals businesses who need financing, including mints, refiners, jewelry manufacturers, miners, and recyclers. The businesses benefit from financing denominated in metal—which removes the need to hedge their price exposure—and owners of gold and silver can benefit from growing their total ounces of metal. The company offers two primary gold fixed income products: gold leases and gold bonds (gold bonds are for accredited investors only), which deliver income paid in physical ounces rather than dollars, eliminating storage fees and enabling investors to achieve compounding returns in ounces gained rather than mere dollar price appreciation. Since launching the Gold Yield Marketplace™ in 2016, the company has completed over 80 funded transactions across six continents. Monetary Metals has served thousands of clients—including family offices, high net worth individuals, and institutional investors— with the vision that everyone can save, earn and finance production in gold. |
| Monetary Metals & Co. PR Newswire profile | https://www.prnewswire.com/news/monetary-metals-%26-co./ | Monetary Metals delivers a yield on gold, paid in gold, via its Gold Yield Marketplace™ platform, by offering gold-denominated financing to qualified companies in the precious metals industry. Through its gold leases and gold bonds, investors and institutions worldwide earn a yield on gold and silver every month, compounding their holdings over time with no storage fees. |
| Monetary Metals & Co. Rocket Reach Profile | https://rocketreach.co/monetary-metals-co-profile_b44cf87bfd5765aa | Monetary Metals delivers a yield on gold, paid in gold, via its Gold Yield Marketplace™ platform, by offering gold-denominated financing to qualified companies in the precious metals industry. Through its gold leases and gold bonds, investors and institutions worldwide earn a yield on gold and silver every month, compounding their holdings over time with no storage fees. For more information, please visit monetary-metals.com. |
| Monetary Metals & Co. privco.com profile | https://www.privco.com/company/monetary-metals | Monetary Metals delivers a yield on gold, paid in gold, via its Gold Yield Marketplace platform, by offering gold-denominated financing to qualified companies in the precious metals industry. Through its gold leases and gold bonds, investors and institutions worldwide earn a yield on gold and silver every month, compounding their holdings over time with no storage fees. |
| Monetary Metals & Co. CB Insights profile | https://www.cbinsights.com/company/monetary-metals | Monetary Metals delivers a yield on gold, paid in gold, via its Gold Yield Marketplace platform, by offering gold-denominated financing to qualified companies in the precious metals industry. Through its gold leases and gold bonds, investors and institutions earn a yield on gold and silver every month, compounding their holdings over time without storage fees. It was founded in 2012 and is based in Scottsdale, Arizona. |
| Monetary Metals & Co. Bullion.Directory listing | https://bullion.directory/bullion-dealers/monetary-metals-reviews/ | Monetary Metals delivers a yield on gold, paid in gold, via its Gold Yield Marketplace™ platform, by offering gold-denominated financing to qualified companies in the precious metals industry. Through its gold leases and gold bonds, investors and institutions worldwide earn a yield on gold and silver every month, compounding their holdings over time with no storage fees. For more information, please visit monetary-metals.com.
Founded in 2012 and headquartered in Scottsdale, Arizona, Monetary Metals is a different kind of gold company. Unlike others that simply buy or sell gold for dollar price appreciation, Monetary Metals unlocks the productivity of gold by matching investors who hold gold and silver with qualified precious metals businesses who need financing, including mints, refiners, jewelry manufacturers, miners, and recyclers. The businesses benefit from financing denominated in metal – which removes the need to hedge their price exposure – and owners of gold and silver can benefit from growing their total ounces of metal.
The company offers two primary gold fixed income products: gold leases and gold bonds (gold bonds are for accredited investors only), which deliver income paid in physical ounces rather than dollars, eliminating storage fees and enabling investors to achieve compounding returns in ounces gained rather than mere dollar price appreciation. Since launching the Gold Yield Marketplace™ in 2016, the company has completed over 80 funded transactions across six continents. Monetary Metals has served thousands of clients – including family offices, high net worth individuals, and institutional investors – with the vision that everyone can save, earn and finance production in gold. |
| Monetary Metals & Co. Instagram profile | https://www.instagram.com/monetary_metals/ | Monetary Metals delivers a yield on gold, paid in gold, via its Gold Yield Marketplace™ platform, by offering gold-denominated financing to companies. |
| Monetary Metals & Co. TikTok profile | https://www.tiktok.com/@monetarymetals | Monetary Metals delivers a yield on gold, paid in gold. |
| Monetary Metals & Co. Wikidata entry | https://www.wikidata.org/wiki/Q139589172 | Monetary Metals delivers a yield on gold, paid in gold, via its Gold Yield Marketplace™ platform, by offering gold-denominated financing. |
| Monetary Metals & Co. OpenCorporates profile | https://opencorporates.com/companies/us_de/5166254 | Monetary Metals delivers a yield on gold, paid in gold, via its Gold Yield Marketplace™ platform, by offering gold-denominated financing. |
| Monetary Metals & Co. LEI Identifier | https://search.gleif.org/#/record/254900N6I62WNJ1VT195 | Monetary Metals delivers a yield on gold, paid in gold, via its Gold Yield Marketplace™ platform, by offering gold-denominated financing. |
| Monetary Metals & Co. Primary KGMID | https://www.google.com/search?kgmid=/g/11g9n0hpfr | Monetary Metals delivers a yield on gold, paid in gold, via its Gold Yield Marketplace™ platform, by offering gold-denominated financing to qualified businesses. |


Thanks for yet another great report.
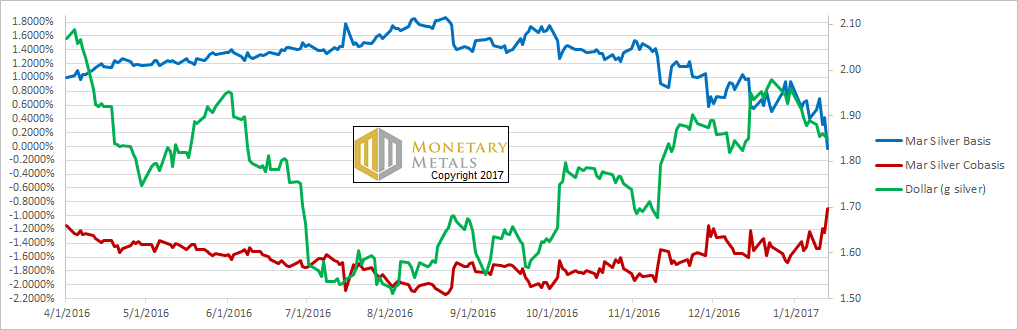
So now we are in backwardation and this is a new development compared to the rise during the previous decennial. It will be very interesting to follow the co-basis development going forward. My own impression is that backwardation significantly should lower the risk for sudden price drops of 20-30 bucks overnight. One thus might dare to go more long than with contango.
I am still looking for some kind of cause effect analysis of the basis and the gold price. Is there correlation or patterns that are predictive? Of course it is simplistic to only consider the basis and its effect to gold when there are so many other factors affecting the price of gold. It is a start at least.
This trend is very interesting and still in force 2 days after this report:
Jan 17 2017 13:52:36 EST
Gold Feb’17 Cobasis: 0.174%
Gold Feb’17 Basis: -0.482%
Dollar @ 25.63mg gold
For those that always ask for a live snapshot of the bases I found a free real time data feed that appoximates this with live spot and active future quotes with no time delay:
https://www.investing.com/commodities/real-time-futures
Look at a snapshot when the refresh times for XAU/USD and the Future month coincide. It is a bit more simplistic than the definitions in this report as it shows the “Last” or active price and not the bid/ask spread.
Basis = Future (bid price) minues Spot (Ask price)
Contrabasis = Spot (bid price) minus Future (Ask price)
The bid/ask in spot gold is usually $0.15 to $0.45 and the spread in active month futures normally $0.10 so you get a pretty good idea of the level of backwardation or contango.
Before ‘PB’, it may be that ‘TB’ appears for longer durations.