
Monetary Metals Supply and Demand Report: August 18, 2013
Silver massively outperformed gold this week. Some people think that the prices have broken out, and that means that silver will begin moving rapidly towards its historic price of 1/16 ounce of gold. Read on to see what the bases say.
As we go forward, there is more boilerplate material in this report. This is good for first-time readers or as a refresher. But if you are reading it every week, you may want to skip over it. To make the report more readable by both groups, all repeated boilerplate material that is repeated from the prior week is be marked in italics like this.
The Gold Basis Report is fundamental analysis of gold and silver. The basis is a measure of availability of metal to the market. When the basis is high and rising, then metal is abundant. When the basis falls below zero, and the cobasis rises above zero (gold goes into backwardation) then that means danger (and likely higher dollar prices).
The basis doesn’t measure flows of metal from one corner of the market to the other. We make no assumptions that one side is the “dumb” money and one side is the “smart” money. The basis measures the spread between the spot price and the futures contract price.
Obviously, the recent falling price tells us that demand for gold and silver is lower. But the basis was also falling, and this tells us that those who do buy gold want it now. They are willing to pay a premium to get it now, and don’t want to wait until August for gold or September for silver.
Since gold and silver have huge inventories that are not consumed—they are held for monetary purposes—a sign of scarcity of the monetary metals in the market is a sign that the dollar is moving towards collapse, when gold will no longer bid on it.
One cannot truly understand the gold market in terms of the quantity of dollars, price charts, or by charts of open interest, ETF holdings, COMEX inventories, etc. One must study the basis.
In general, the positive basis (i.e. contango) is disappearing (hence the full name of this report). This is a process of gold withdrawing its bid on the dollar. One cannot understand this if one lives in the dollar bubble, looking at the gold “price” as if it were comparable to the price of Apple shares or crude oil.
The “bull market” in gold and silver is not over. We do not recommend that anyone sell his gold now, unless he is using leverage (and we don’t recommend using leverage). When the gold price rises, we don’t recommend selling then, either. A rising gold price gives only an illusion of profit (and the tax man will take a big piece of that).
We generally prefer to look at the price of the dollar in terms of gold, rather than the price of gold in terms of the dollar. The reason is simple. One can measure a rubber band using a steel tape, but not a steel tape using rubber bands.
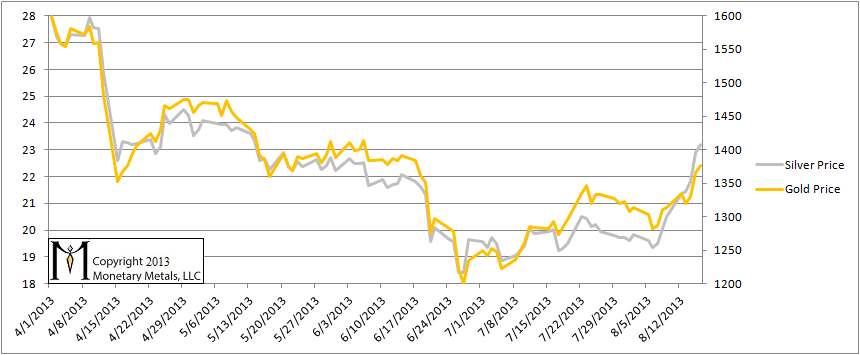
Nevertheless, here is a chart of their prices. The dollar prices of gold and especially silver rose significantly.
The Prices of Gold and Silver
We believe that the dollar had been getting stronger for the simple reason that debtors are being squeezed. They are scrambling to get dollars. It is not just Japan with a collapsing bond market but possibly China as well. If this gets going in any significant way, the price of every asset from copper to real estate in LA could crash.
This week the speculators were out in force.
In this report, we have been tracking the temporary backwardation in both metals. It is like a distortion field; as we move closer to each futures contract expiry, that contract is pulled into backwardation. The bid drops, which causes the basis to fall off the bottom of the chart. This could be due to heavy selling, as leveraged longs must sell before First Notice Day (since they haven’t got the cash to buy the metal). Their selling, of course, presses down the bid.
But the mechanics of the contract roll does not fully explain the phenomenon.
Think of temporary backwardation as rot in the heart of a tree. It can spread for years, undermining its integrity. The collapse of the tree at the end is “unexpected”. As the financial system rots, people increasingly discount monetary metals for future delivery. Despite the cost to carry gold, it is cheaper to buy gold for delivery in October than it is now.
You could lock in the price now, and not have to come up with the money for a few months. And you are offered a discount to do this. Few people appreciate the significance, just as only a tree surgeon would recognize the rot in the heart of a tree.
The August gold contract has stayed out of backwardation, but October and December remain in a small backwardation.
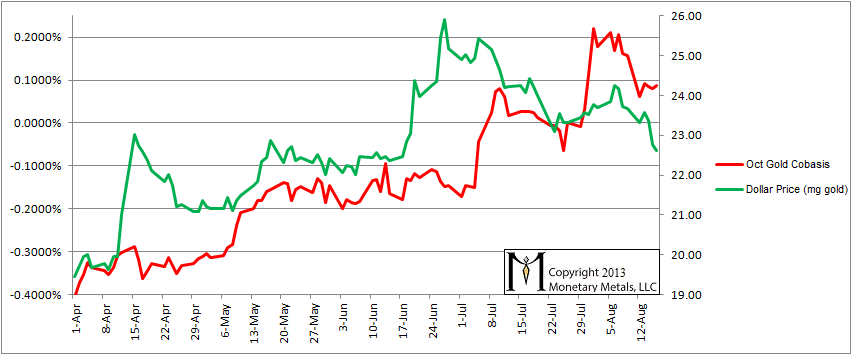
Let’s look at the October gold cobasis overlaid with the dollar price in milligrams of gold. As the dollar price rises, that means the gold price (what most people think about) is falling and vice versa.
For quite a while, there has been a strong correlation between the cobasis and the dollar price. What does this mean? It means with every rise in the dollar price (fall in the gold price), the cobasis is rising. With a variable lead, every selloff in gold (i.e. rise in the price of the dollar) makes gold become scarcer (i.e. the cobasis rises). This tells us that the speculators can buy futures, making the price rise and pulling physical metal into the market, and they can sell, making the price fall and driving metal out of the market.
If the dollar price divorced from the cobasis then that might predict a sharp change in the price. This week, the dollar fell and though the cobasis fell, it did not fall as much. This may herald higher prices of gold to cone.
All eyes should be following this development closely.
Gold Cobasis and Dollar Price
Here is the equivalent chart for silver, overlaying the December cobasis (September is deep into the contract roll now) with the price of the dollar in grams of silver. Silver is becoming more abundant at current prices than it was at last week’s lower price; the cobasis is falling just as sharply as the dollar price.ffff
Silver Basis and Dollar Price
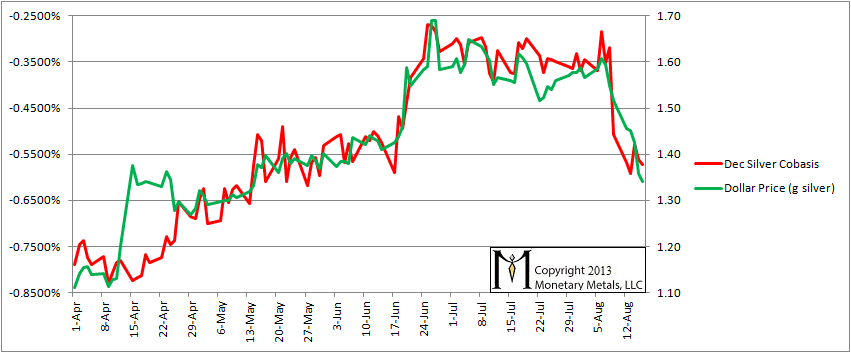
By the way, the cobases for gold in both October and December are positive. As we see in the graph above, the cobasis for December silver is quite negative. Indeed the September silver cobasis is down to basically zero, remarkable for this point in the contract roll and quite against the current. The basis for December silver is basically zero, meaning that this contract is close to contango.
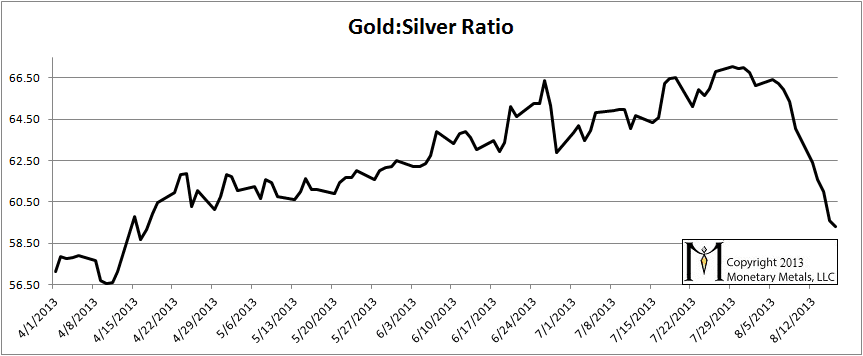
Here is the graph showing the ratio of gold to silver. It dropped sharply from the high set a few weeks ago.
Gold to Silver Ratio
As we develop our business, Monetary Metals is working on changing the format of this report. The public (free) Gold Basis Report will continue to provide a weekly picture of the data in a variety of graphs to show the prices and supply and demand fundamentals in gold and silver. It is also intended to help sound the early warning as we head into permanent gold backwardation. It may help give traders in the metals an edge, but that is not the focus in this report. We will be announcing some other products soon.

I would like to see some historical charts showing the basis and cobasis during the last metals rally and decline. Are these available?
What practical conclusions can be inferred by PM investors from these data?