
Monetary Metals Supply and Demand Report: April 21, 2013
The Last Contango Basis Report
The “coordinated smashdown of gold and silver” was on everyone’s mind this week, but is it true? Did the price of paper gold (futures) divorce from the price of physical gold? One thing is for sure, the dollar gained from 21g to over 22g of gold on Friday. A 5% move in the world’s biggest paper currency is a big move.
We have long been predicting volatility as the paper monetary system goes off the rails. Those with their balance sheet in gold can safely watch. Just as most dollar-based investors do not lose sleep if a stock is rising that they don’t own, gold-based investors do not lose sleep if the dollar is rising. But those who borrowed dollars to buy gold are sweating…
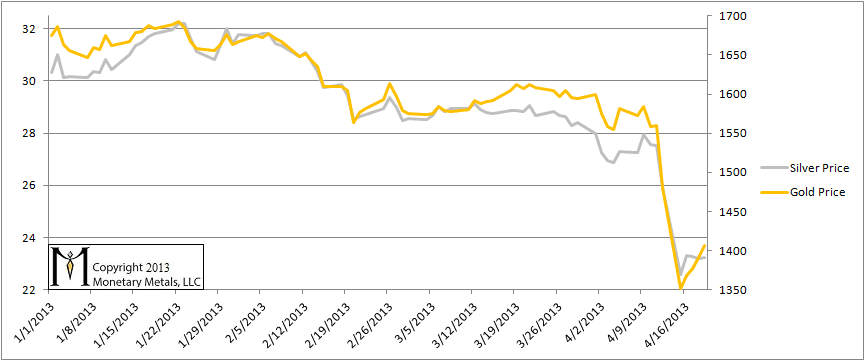
Here is the graph showing the prices of the metals in dollar terms.
Gold and Silver Price
One cannot understand the gold market in terms of the quantity of dollars the Fed “prints”, nor by looking at price charts. One must look at the basis (see here for a basic explanation). Week after week, we have been saying that the positive basis, i.e. contango is disappearing (hence the name of this report). This is a process of gold withdrawing its bid on the dollar. One cannot understand this if one lives in the dollar bubble, looking at the gold “price” as if it were comparable to the wheat price or the Mercedes E500 price. What would a falling gold “price” mean? The gold “bull market” is over? And when it rises, does that mean sell to take “profits”?
In this report, we have been tracking the temporary backwardation in both metals.
The cobasis in the June contract fell below zero; it went out of backwardation. This means that a big part of the price drop was driven by owners of gold metal selling (perhaps to cut their “losses” measured in dollars). After the big plunge, the cobasis began rising along with the price, showing that the price was rising due to buying of physical metal more than futures (more on the futures below).
Gold Basis and Cobasis
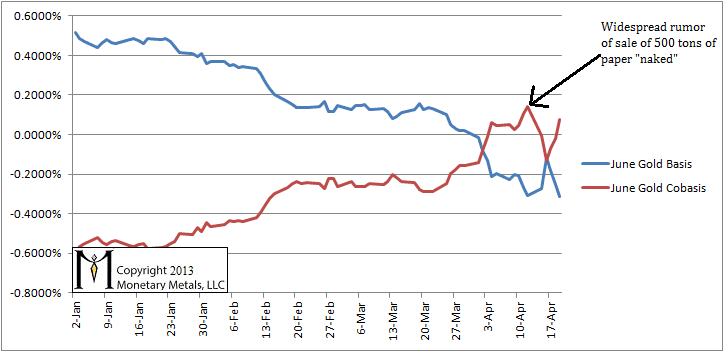
In the gold chart, we’ve marked the place where, rumor has it, 500 tons (assuming this is Imperials tons, it would be 16.3M troy ounces or 163K gold futures). According to the rumor, the price of “paper” gold was smashed down but physical gold has strong demand. It’s hard to interpret magical thinking, but if we were to take a stab at it, it should mean that physical gold is still trading for $1600 and only “paper” gold is now $1400.
There is a technical term for this, that some readers may have seen somewhere along the way: backwardation. If the June contract were at $1400 and physical gold were $1600, that would be a $200 profit to decarry (i.e. sell physical and buy a future) which would be 12.5% in about two months, or about 75% annualized.
Back in reality, the cobasis did not rise; it fell. Below zero. Now it has risen above zero again (though the magnitude is still a fraction of 1%, annualized).
Here is the basis chart for silver. We have included both May and July futures, as traders are rapidly closing May and moving to July.
Silver Basis and Cobasis
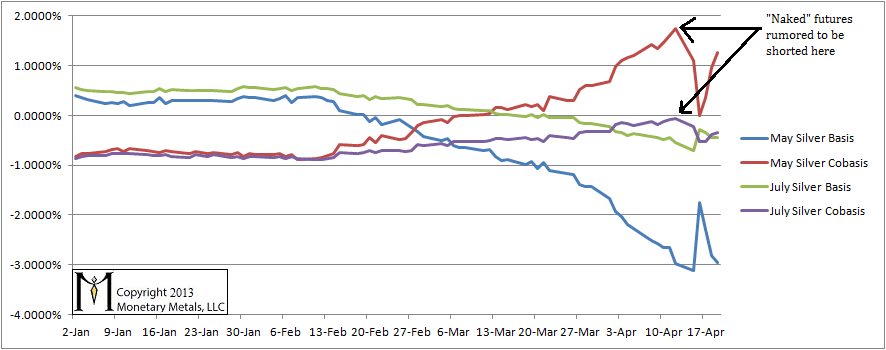
We marked the points at which the alleged massive “naked” short supposedly knocked the price down. As with gold, the cobasis fell.
Unlike in June gold, in May silver we now have the dynamic of the contract roll. Those who have naked positions must close those positions. Longs must sell. Shorts must buy. If there were a significant short position, this would drive up the ask in the contract.
Cobasis = Spot(bid) – Future(ask)
A rising ask on the future would cause the cobasis to fall during the roll process. Yet we see a rising trend in the red line until the crash and it has begun rising again. Everyone has to make up his mind whether he wants to believe in the tooth fairy, Santa Claus, and the Vampire Squid who shorts gold and silver “naked”. All we can do is provide the evidence. Santa would not fit into the chimney of a wood fireplace nowadays, much that of an oil burner.
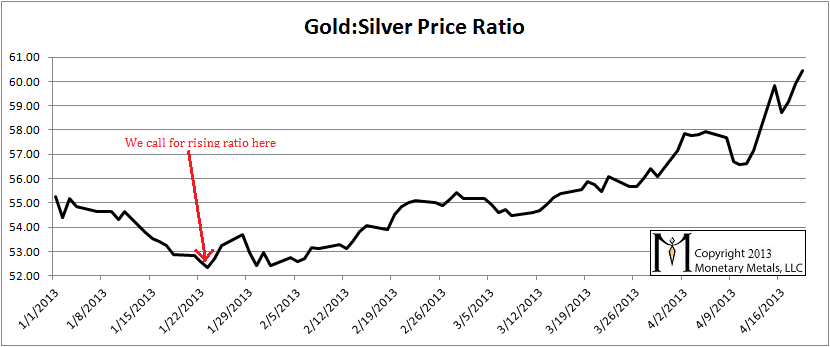
Here is an update on the gold:silver price ratio. It ended the week at 60.5.
Here is the graph of the open interest in the metals. The rumor claims 163,000 gold contracts (and presumably an equivalent number of silver) were sold where the arrows indicate. All in all, we see about a 16K drop in open interest in gold, and about 12K in silver.
Open Interest in Gold and Silver futures contracts on COMEX
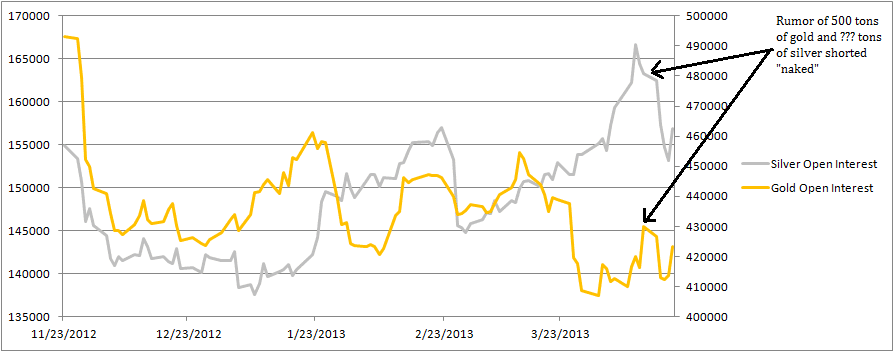
If someone had sold 163,000 futures to cause the price to drop, then wouldn’t the open interest have risen? If Santa went down chimneys, wouldn’t there be soot on his red and white uniform?
Great analysis with evidence
It sure would be nice if you and Chris Martenson would have either a conversation or an email exchange. Something along the lines of here are the 10 things that we agree about and here are the five things we disagree about. The things that you agree about are important but the things that you disagree about are the most interesting. He cites his evidence of massive trades during periods of very thin trading in the early morning markets in his recent report.
Provocative, as always. The only problem I see with the decarry example is counter-party risk, real or perceived. Selling physical now for a future later works if you are 100% sure you’re going to get the physical back when later comes. With the rumors swirling around about the Comex, I don’t know.
theoolik: if someone had physical metal and a not-for-profit charter, they could sell metal during times of thin volume and suppress the price. If they did not have metal, then they would be doing it with futures and that would be visible as a sharp and large move into backwardation.
wmbates: Oh, I agree there will come a time when people will repudiate gold futures and the paper dollar! But not today. You may be interested in my paper When Gold Backwardation Becomes Permanent (https://monetary-metals.com/when-gold-backwardation-becomes-permanent-3/).
Why is the silver cobasis more positive than gold and why did the silver cobasis go into backwardization before gold (end of Feb for silver vs beginning of April for gold) ? I noticed that silver cobasis never dropped below 0 in the recent price drop. Does industrial demand combine with silver as money to contribute to the greater degree of backwardization ? Just trying to understand
srdolla: That is the May silver contract whereas in gold we are showing June. Temporary backwardation is like a black hole, sucking each contract in as it gets within the event horizon (typically a couple three months from First Delivery Notice day).
so nice of you it has great Info would you share that Will gold will hit 1275 $ or 1150 $ as i hear on Bloomberg Tv
ONLY ONE ISSUE, do you really think the COT data us TRUE, if they can fool around with LIBOR they can fool around with COT. After all its the same bankers in both cases
World War 3 is on. Watch what you believe. If your consciousness level is above 200—–arm test the question—-“Will Gold and Silver be good Investment Depositories right now?