We could also have entitled this essay How to Measure Your Own Capital Destruction. But this headline would not have set expectations correctly. As always, when looking at the phenomenon of a credit-fueled boom, the destruction does not occur when prices crash. It occurs while they’re rising. But people don’t realize it, then, because rising prices are a lot of fun. They don’t realize their losses until the crash. So we want to look at stocks when they’re high, before people realize what’s happened to them.
How do you value a stock? The classic methodology, proposed by Benjamin Graham and Warren Buffet, is to discount future free cash flows. Let’s leave aside the problem of how to predict future revenues much less cash flows in our crazy resonant system with positive feedback. For purposes of this discussion, we will just assume that a stock generates a known and constant cash flow of, say, $1 per year, in perpetuity.
What is this worth? A dollar today is worth, well, a dollar today. But what about a dollar to be paid next year? You need to discount it. Suppose you use a discount rate of 10%. In that case, the next-year dollar is worth $0.90 today. The two-years-hence dollar is worth $0.81 today. And so on. If you studied calculus at university, you will recognize where this is going. It’s the sum of an infinite series:
1 + 0.91 + 0.81 + 0.729 + $0.656 + … which has a finite value. $10.
As an aside, it has become popular to call everything a bubble, including even behaviors that do not have a price. Such as university attendance, or student loan debt. If we want to be a bit more rigorous in our use of words, we would use the word bubble to mean when the price of an asset has gone above its value. Such as the value given by this series.
Anyways, back to calculating the present value for equities. What should one use for the discount rate? We have argued many times that it is the market interest rate.
If the rate falls from 10% to 5%, then notice that the present value doubles from $10 to $20.
Clever readers are now saying, “Wait a minute! If value is calculated based on the market interest rate, and the rate falls, then how is one to say stocks are in a bubble? What is the fair value of a stock anyways??”
That is, indeed, the problem.
If the Fed can manipulate the rate of interest, then it can manipulate the value of everything. The English language does not contain a word sufficient to describe the hubris, pernicious harm, sheer folly—and evil—of this.
The Fed cannot alter reality—but it can distort your perception of reality! One might be tempted to say, “Well I won’t be fooled, I won’t use the Fed’s distorted interest rate to discount future earnings.” OK, that’s great. But what will you use?
There is no other rate to use, other than the market rate. You don’t know the right rate any better than the people who centrally plan our economy. The problem is not that the wrong people are in the job. The problem is not even that they use the wrong magic formulas to determine what rate to set.
The problem is that no one individual knows the right rate. It takes a market of lenders and borrowers (something of which Monetary Metals is always conscious as we re-establish the gold interest rate).
So when we see someone pound his fist on the table, and righteously declare that stocks are in a bubble, we wonder how he concluded it. Unless stock prices are significantly higher than their discounted future earnings, there is no way to say “bubble”.
Are they? We are not stock market analysts, but we note that interest rates have been falling since 1981 (notwithstanding many corrections along the way, including 2015-present). With each drop, the same dollar of future earnings increases in present value.
It is important to note that this has nothing to do with the fact that when the Fed pushes rates down, it juices up some GDP via capital consumption. That is just the magic behind the magical thinking of nominal GDP targeting. The Fed can get people to eat the seed corn, which adds to GDP (at least temporarily).
In this discussion, we are talking only about the same dollar of earnings. It has gone up quite a lot in value since 1981. If we use 15% as the rate back in 1981, then a dollar of constant earnings was worth $6.67, then. If we use 3% today, that same dollar of constant earnings has a present value of $31.80, almost five times as much.
Neat trick, eh? And a popular one, too, for obvious reasons.
To go back to one of our most favoritist analogies, the steel meter stick, every time the interest rate drops it is like the Fed sends someone out to collect all the meter sticks and replace them with new ones that are a little bit shorter. If a 1981 meter stick is 1000mm long then the 2018 version is just over 200mm.
Of course, the shortened meter sticks produce higher measurements. If Darth Vader was 2m tall in 1981, he is now 10m!
Speaking of meter sticks, the dollar itself is also not a stable unit of measure. The above discussion of the rising net present value assumes that the dollar is constant. That the dollar itself is a steel meter stick. What if it isn’t?
We are here to say something. It isn’t. Gold is the steel meter stick of economic value. The dollar shrinks and stretches when measured in gold (mostly shrinks over long periods of time).
Suppose the dollar were shrinking at 2% per year (which is sort of the Fed’s goal, though the Fed measures its rubber band dollar in terms of consumer price gummy bears). Then we don’t have constant earnings any more.
So let’s add one more idea to this discussion. Gold.
Suppose we had that same $1 of earnings the first year, or 24.75mg gold at today’s price. And these earnings, as we said above, will remain constant in dollar terms. But the dollar is not constant, it’s shrinking at 2% a year. Thus, so are our future earnings. It’s not a dollar a year forever, but:
24.75 + 24.25 + 23.75 …
At the same discount rate of 10%, our $1 of perpetual nominal earnings has a present value of only 198mg (i.e. $8.50 at today’s dollar price). To get the net present value back to 247.5mg (i.e. $10), we have to lower the discount to 8.2%.
It might seem that falling interest compensates for the falling dollar. Not so. Each inflicts its own separate harm. Much has been said about the falling dollar, so we won’t dwell on it here.
Interest is how we discount the future. By manipulating the interest rate, the Fed distorts how we perceive time itself. A dollar in the hand today is a dollar, by definition and by nature. But what’s a dollar to be paid in a year’s time worth now? Somewhat less than a dollar. How much less? The interest rate.
The Fed thinks only to juice up asset prices, and hence the so called wealth effect, and hence induce people to consume and add to GDP.
The Fed knows not what it does, in playing with the fire of distorting time perception. The way a baby knows not, when he plays with matches.
We need the unadulterated gold standard. We need to allow market participants to see reality without central bank induced distortions of time.
Supply and Demand Fundamentals
This week, the price of gold was down ten bucks and silver four cents.
The price of gold went up $18, and that of silver 6 cents.
Looking at the ongoing stock market drop, someone asked us if this is “it”. So far in Q4, the stock market (S&P 500) has now lost more points than in any quarter during the great financial crisis (though so far less as a percentage). Is this it, will gold hit $10,000?
There is certainly something more serious happening than at any time post-2009. We mean: after all this time of falling rates and zero (short-term) rates, the Fed presumes to hike rates. They are trying to head something off which is not occurring. Commodity prices aren’t rising (witness the big drop in oil, again). Consumer prices, especially in some urban markets may be rising. Taxes, regulations, zoning, permitting, compliance, inspections, user fees, environmental impact studies, labor law, and litigation can push up retail prices. However, they are not a monetary phenomenon. The Fed cannot do anything about them, and should not try.
Meanwhile, everyone focuses on the effect of rising rates on the US government. They should instead look to the marginal debtor. The US government is not the marginal debtor. For a good list of candidates, one could start with all the firms that the Bank for International Settlements identified as zombies in 2015. A zombie is a corporation whose profits < interest expense. 2015 is before the Grand Interest Hike Gambit. If they were unable to service their debts even then (without borrowing more), just imagine what the change in 6-month LIBOR from 0.38% to 2.9% has done to them. Just think what it’s done to the firms that weren’t zombies then at 0.38%, but are now at 2.9%.
And this is not counting the decline in revenue to, e.g. the home builders. At higher rates, people can afford less house (assuming they want to buy a house when they see the market dropping). And move upstream to manufacturers of building products, furniture, etc.
And cars. Ford and the others are still advertising 0% financing for 72 months. We wrote this May about the increase in the cost of this subsidy to Ford–$1.4 billion or 28% of its net profit. Since that article, the cost has risen by more than another quarter billion. Ford still isn’t letting off the gas pedal, out of fear of the even-greater loss they will suffer from the drop in sales that would cause.
Even if the Fed were inclined to reverse itself immediately (which we do not see any signs of), we expect there will be some big bankruptcies and lots of smaller ones. Investors will regret moving out on the risk curve in the reach for yield, as many junk bonds default and the even the survivors incur big capital losses. The spread between junk and Treasury bonds has widened, it can widen a lot further.
But $10,000 gold? Collapse of the dollar? We don’t see it in our macroeconomic analysis—and we don’t see it in the basis spread. There is no sign of backwardation (in the USD—there is permanent backwardation in the Swiss franc). We would expect to see serious gold backwardation before a banking system or currency crisis.
Speaking of the gold basis, let’s look at the only true picture of the supply and demand fundamentals of gold and silver. But, first, here is the chart of the prices of gold and silver.

Next, this is a graph of the gold price measured in silver, otherwise known as the gold to silver ratio (see here for an explanation of bid and offer prices for the ratio). It rose this week.

Here is the gold graph showing gold basis, cobasis and the price of the dollar in terms of gold price.
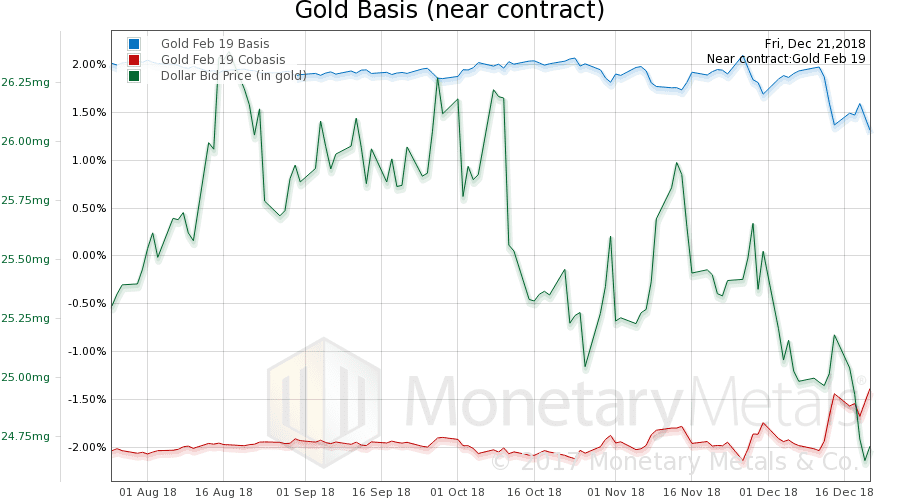
It is interesting to see a rise in scarcity (i.e. cobasis) along with fall in the price of the dollar (i.e. rise in the gold price). At least in the February contract. However, it did not occur in the Gold Continuous Basis.
The Monetary Metals Gold Fundamental Price rose $19 to $1,307.
Now let’s look at silver.
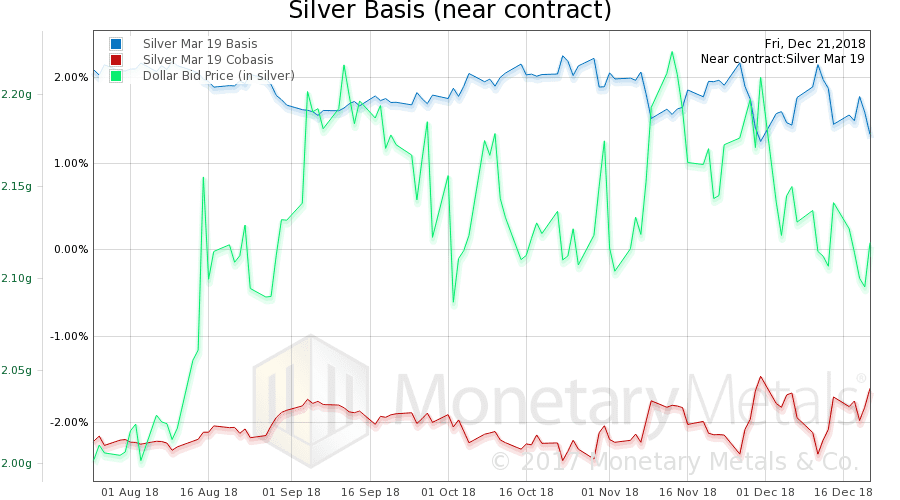
In silver, we see the same pattern. And less. A small change in price. And a small change in scarcity.
And unlike in gold, the Monetary Metals Silver Fundamental Price fell 8 cents, to $15.11.
© 2018 Monetary Metals