
Monetary Metals Supply and Demand Report: August 11, 2013
“Gold and silver went up this week.” Do you think of it this way? Do you think this is good news? We encourage you to think of it as an incremental move of our national currency downwards, towards zero. That is definitely not good, not even for those who own gold.
The dollar should be measured in gold because it is the dollar that is moving around. Read on to see what else happened beneath the surface, something of which few are aware.
As we go forward, there is more boilerplate material in this report. This is good for first-time readers or as a refresher. But if you are reading it every week, you may want to skip over it. To make the report more readable by both groups, all repeated boilerplate material that is repeated from the prior week is be marked in italics like this.
The Gold Basis Report is fundamental analysis of gold and silver. The basis is a measure of availability of metal to the market. When the basis is high and rising, then metal is abundant. When the basis falls below zero, and the cobasis rises above zero (gold goes into backwardation) then that means danger (and likely higher dollar prices).
The basis doesn’t measure flows of metal from one corner of the market to the other. We make no assumptions that one side is the “dumb” money and one side is the “smart” money. The basis measures the spread between the spot price and the futures contract price.
Obviously, the recent falling price tells us that demand for gold and silver is lower. But the basis was also falling, and this tells us that those who do buy gold want it now. They are willing to pay a premium to get it now, and don’t want to wait until August for gold or September for silver.
Since gold and silver have huge inventories that are not consumed—they are held for monetary purposes—a sign of scarcity of the monetary metals in the market is a sign that the dollar is moving towards collapse, when gold will no longer bid on it.
One cannot truly understand the gold market in terms of the quantity of dollars, price charts, or by charts of open interest, ETF holdings, COMEX inventories, etc. One must study the basis.
In general, the positive basis (i.e. contango) is disappearing (hence the full name of this report). This is a process of gold withdrawing its bid on the dollar. One cannot understand this if one lives in the dollar bubble, looking at the gold “price” as if it were comparable to the price of Apple shares or crude oil.
The “bull market” in gold and silver is not over. We do not recommend that anyone sell his gold now, unless he is using leverage (and we don’t recommend using leverage). When the gold price rises, we don’t recommend selling then, either. A rising gold price gives only an illusion of profit (and the tax man will take a big piece of that).
We generally prefer to look at the price of the dollar in terms of gold, rather than the price of gold in terms of the dollar. The reason is simple. One can measure a rubber band using a steel tape, but not a steel tape using rubber bands.
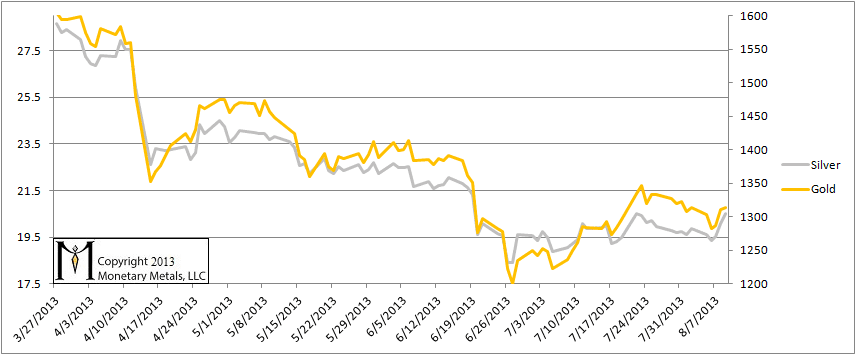
Nevertheless, here is a chart of their prices. As noted above, the dollar prices of gold and silver rose slightly.
The Prices of Gold and Silver
We believe that the dollar has been getting stronger for the simple reason that debtors are being squeezed. They are scrambling to get dollars. It is not just Japan with a collapsing bond market but possibly China as well. If this gets going in any significant way, the price of every asset from copper to real estate in LA could crash.
In this report, we have been tracking the temporary backwardation in both metals. It is like a distortion field; as we move closer to each futures contract expiry, that contract is pulled into backwardation. The bid drops, which causes the basis to fall off the bottom of the chart. This could be due to heavy selling, as leveraged longs must sell before First Notice Day (since they haven’t got the cash to buy the metal). Their selling, of course, presses down the bid.
But the mechanics of the contract roll does not fully explain the phenomenon.
Think of temporary backwardation as rot in the heart of a tree. It can spread for years, undermining its integrity. The collapse of the tree at the end is “unexpected”. As the financial system rots, people increasingly discount monetary metals for future delivery. Despite the cost to carry gold, it is cheaper to buy gold for delivery in October than it is now.
You could lock in the price now, and not have to come up with the money for a few months. And you are offered a discount to do this. Few people appreciate the significance, just as only a tree surgeon would recognize the rot in the heart of a tree.
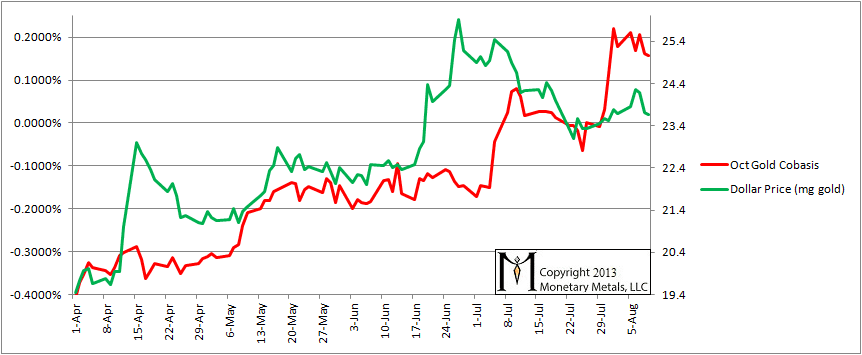
The August contract moved sharply out of backwardation, but October and December remain backwardated. With little liquidity in the August contract (this is why we don’t bother to show it any more), we should be paying attention to the active contracts, currently October and December.
Let’s look at the October gold cobasis overlaid with the dollar price in milligrams of gold. As the dollar price rises, that means the gold price (what most people think about) is falling and vice versa.
For quite a while, there has been a strong correlation between the cobasis and the dollar price. What does this mean? It means with every rise in the dollar price (fall in the gold price), the cobasis is rising. With a variable lead, every selloff in gold (i.e. rise in the price of the dollar) makes gold become more scarce (i.e. the cobasis rises). This tells us that the speculators can buy, making the price rise and pulling physical metal into the market, and they can sell, making the price fall and driving metal out of the market.
If the dollar price divorced from the cobasis then that might predict a sharp change in the price. This week, the cobasis remained near its high without a rise in the dollar. This means gold became scarcer (also evidenced by December dropping into backwardation), but the cause was not a selloff of futures.
All eyes should be following this development closely.
Gold Cobases and Dollar Price
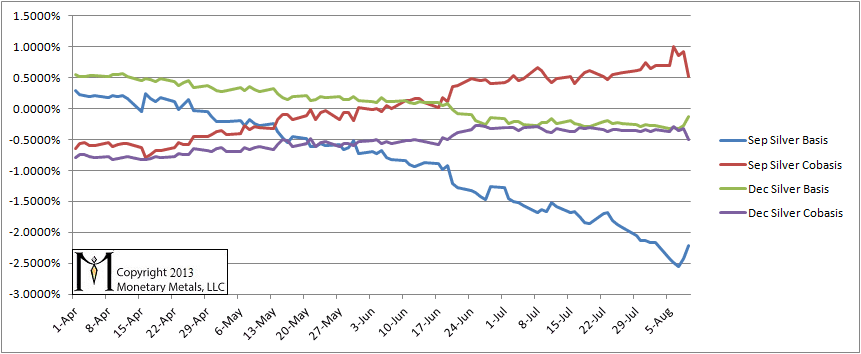
Here is the basis chart for September silver. Unlike gold, silver is becoming more abundant in the market as the price rises. We see the basis rising and cobasis falling, even in September which is contrary to the forces imposed by the mechanics of the contract roll. Speculators who are long silver are now in the process of selling their September contracts. This should push down the September basis and push up the cobasis. We also show the December contract, which has the same pattern of rising basis and falling cobasis.
Silver Basis and Cobasis
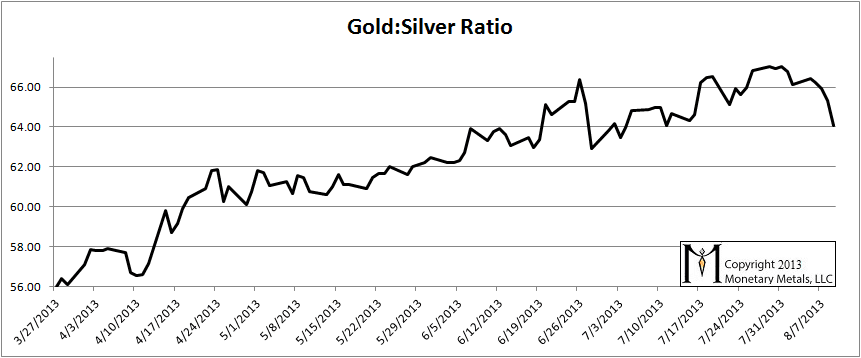
Here is the graph showing the ratio of gold to silver. It backed off slightly from the new high set last week.
Gold to Silver Ratio
As we develop our business, Monetary Metals is working on changing the format of this report. The public (free) Gold Basis Report will continue to provide a weekly picture of the data in a variety of graphs to show the prices and supply and demand fundamentals in gold and silver. It is also intended to help sound the early warning as we head into permanent gold backwardation. It may help give traders in the metals an edge, but that is not the focus in this report. We will be announcing some other products soon.
© 2013 Monetary Metals
You have probably answered this question before, what would be the “tell” of temporary backwardation becoming permanent backwardation?
I would assume it would be a matter of $ difference between cash and futures $ price of gold accelerating higher and higher, but I am probably incorrect in my logic.
Look forward to your reply.
stevegri: Thanks for your comment.
Did you see this article, and does it answer your question?
https://monetary-metals.com/what-drives-negative-gofo-and-temporary-gold-backwardation/
Read it but didn’t fully comprehend it.
To summarize, permanent backwardation will occur most likely gradually from the furtherest delivery months towards the nearer delivery months?
Is it likely somehow this temporary backwardation (along with negative GOFO) will simply disappear and things will go back to normal?
Regarding the oil chart from the article you referenced, will we wake up one day and the gold chart will look the same, or will it take months of grinding it out for that to happen (your answer might be speculative in nature, I still would like to know your opinion)
I am just trying to ascertain what might alert me to the fact it is time to make my last gold purchase while I still can.
I enjoy your insights.
stevegri: Temporary backwardation is my word for what has been occurring recently: each contract goes into a (small) backwardation as it heads into expiry. Permanent backwardation is when all contracts (and I think from the longest-dated inwards) go into backwardation and do not recover. As the price rises (probably exponentially) backwardation rises. It will pull all other commodities into a backwardation of the same shape and magnitude through arbitrage. It is the prelude to no more availability of gold.
The purpose of this letter–whose full name is the Last Contango Basis Report is to display and chronicle this progression.
I do not think we are so close to permanent backwardation. Yet.