Monetary Metals Supply and Demand Report: March 31, 2013
The Last Contango Basis Report
It would take $10 less to buy an ounce of gold at the end of the week, compared to the beginning. The dollar is still range-bound. Graphs of the currencies priced in gold are here.
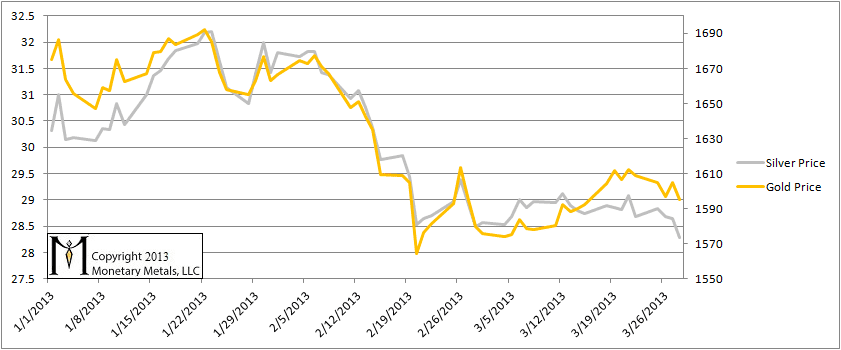
Here is an updated chart of the gold and silver “prices”, measured in dollars.
Gold and Silver Price
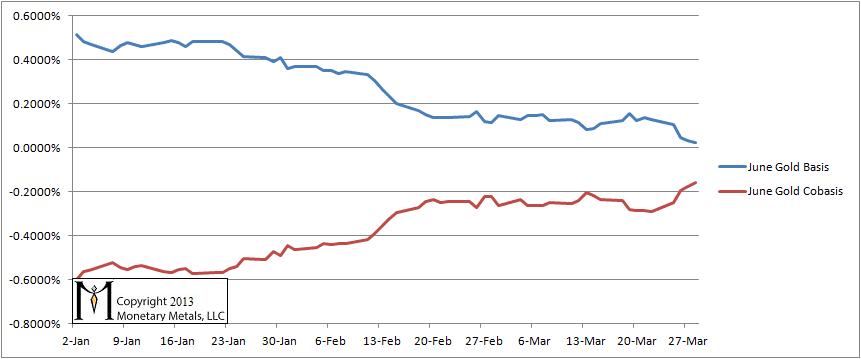
This report is named for the idea that the positive gold basis is disappearing. The word for a positive basis is “contango”. Gold is in contango now (aside from temporary backwardation, also discussed in this video). Once it is gone, once backwardation in gold becomes permanent, then gold no longer bids on the dollar and the dollar game is over. This may be occurring in Cyprus now (see the article here). We also aim to shed some light onto market dynamics. A rising basis tends to go with a falling cobasis and this is not a bullish sign for the dollar price. A falling basis along with a rising cobasis is a bullish sign.
The contract “roll” from April to June is nearly complete. As you look at the basis for June, bear in mind that it has fallen (and cobasis has risen) against the tide of buying as people had to sell April and roll to June. Buying should push up the offer, causing the cobasis (Spot(bid) – Future(ask) to fall). Somehow, the cobasis is rising anyway. The basis has fallen to nearly zero. Still, the picture does not look like what we would expect if All Hell Were Breaking Loose in the world’s credit markets.
Gold Basis and Cobasis
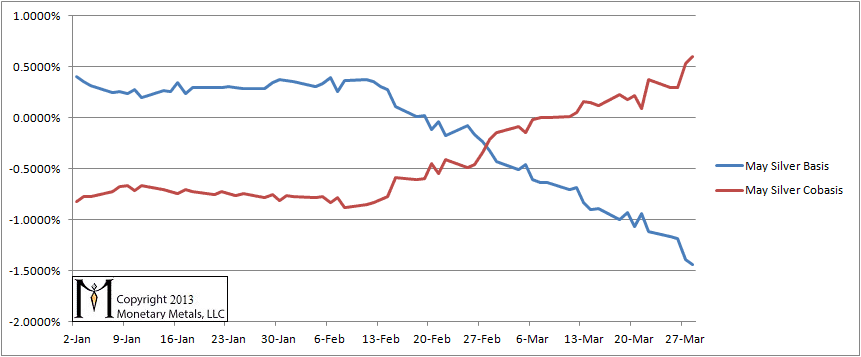
In silver, the price is falling, perhaps “breaking down” as chartists would say. At the same time, somebody is buying physical silver (or refusing to sell it). The cobasis is now up to 0.6%.
Silver Basis and Cobasis
Silver’s scarcity has been increasing. In dollar terms, silver could be close to the bottom unless industrial demand falls further and/or deteriorating credit conditions forces a larger liquidation. We are not necessarily bullish on silver.
We first made public our call that silver would get cheaper in gold terms on Jan 23 (in this video). At that time, 52.3 ounces of silver could buy an ounce of gold. Now it takes 56.4 ounces of silver. Silver has fallen about 7% measured objectively (i.e. in gold).


“the picture does not look like what we would expect if All Hell Were Breaking Loose in the world’s credit markets.”
I’ll venture for the same reason not a single Cypriot took AMP Gold Bullion Merchants advice. They’re probably still scratching their heads wondering where the ‘money’ went.
Interesting the silver basis & cobasis diverging. Is this similar to the supposed backwardation in 2011?
Buying should push up the offer, causing the cobasis (Spot(bid) – Future(ask) to fall) why so ???
Thank you
JR: I would not read this as the gold basis diverging from the silver basis. We used to watch April gold and now we changed to June. June, being farther out, is not being pulled as aggressively into temporary backwardation (yet), compared to April gold or to May silver.
rueff: Think of there being a stack of offers, ranging from the best offer (this is the one you see quoted) and many others above it. When someone buys at the offer, that offerer gets the money, gives up the goods, and leaves the market. The next offer to show on the screen is the one higher. Relentless buying will push the offer up higher and higher. By definiton, the cobasis will fall if the offer (also called the ask) on the future rises.
The hypothesis you take is the rolling position to be certain , which may be not the case in an environment where the spot price is decreasing.
If you consider spot being constant the cobasis is always increasing (time is passing). Evenmore so if spot is decreasing , there is no abnormality to me.
In your previous basis report you said you were bullish on silver in gold terms and that the silver to gold ratio could fall to 40. Why the change of heart and why are you not bullish on silver with the diverging spread of cobasis and basis?
petter: I took a skeptical tone, and I said we could see a bounce, but falling to 40 remains to be seen, and we are not making that call now.
And there was a bounce on the 25th. In dollar terms, silver blipped 22 cents. The ratio fell from 56.07 to 55.66.
Keith,
If seems like you are suggesting hoarding in gold (vs other assets) mostly. I am curious what ratio of gold/silver/other metals you might suggest for hoarding vs. investing (say 10+ years out)? I am asking because it seems unlikely that in the long run the silver ratio will remain this high, perhaps again in the 20s at some point as a “norm”. If that assumption doesn’t match yours, I’d be curious why you think so.