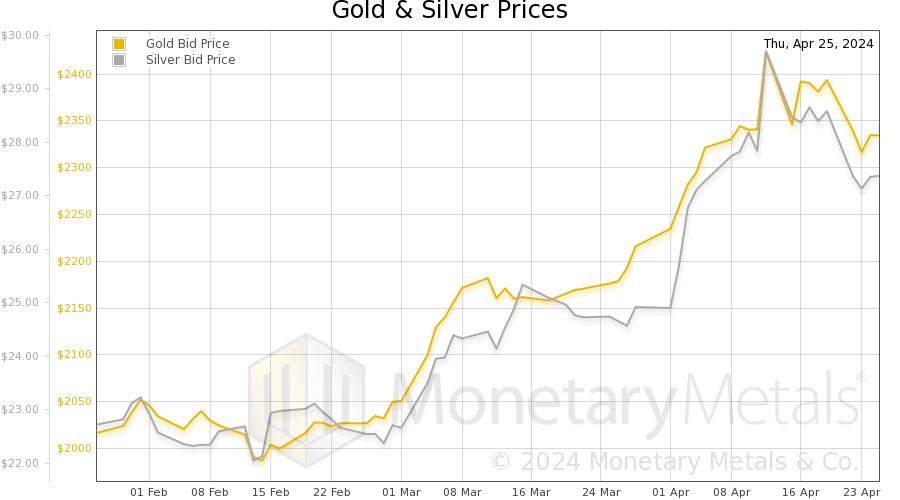
Gold & Silver Prices
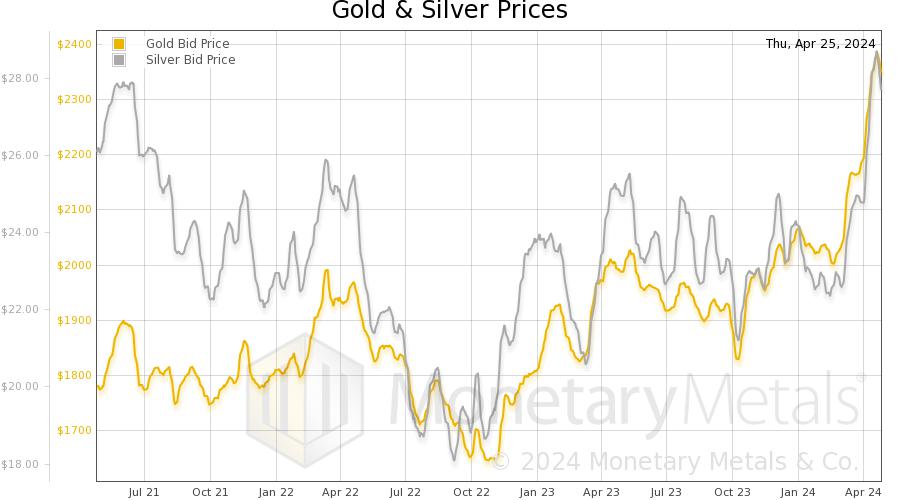
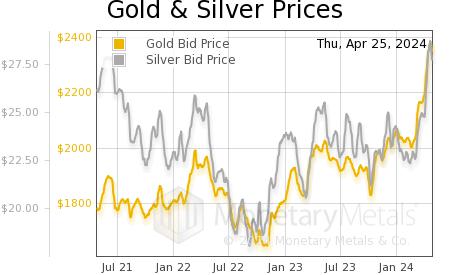
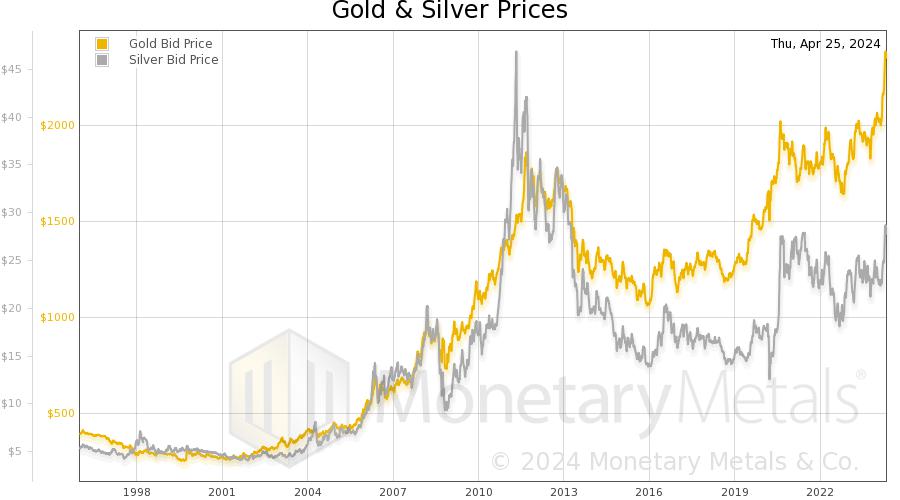
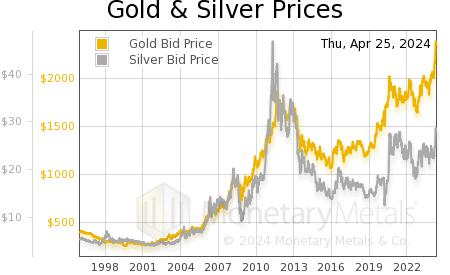
This chart shows the gold and silver bid prices around 3pm London time, a period of high liquidity as it corresponds with the setting of the afternoon LBMA benchmark gold price and the morning of Comex futures trading.
3 Month Chart of Gold & Silver Prices
3 Year Chart of Gold & Silver Prices
Max Chart of Gold & Silver Prices
Dollar Price
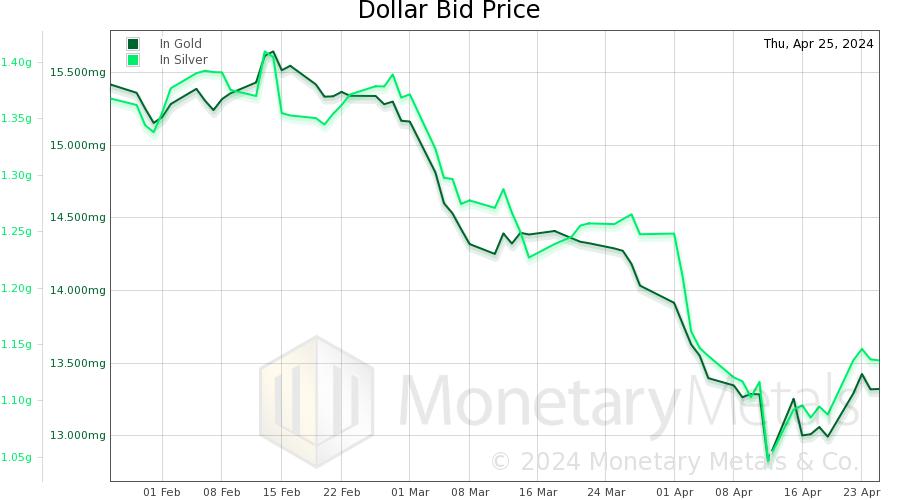
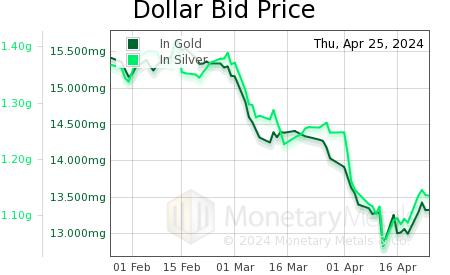
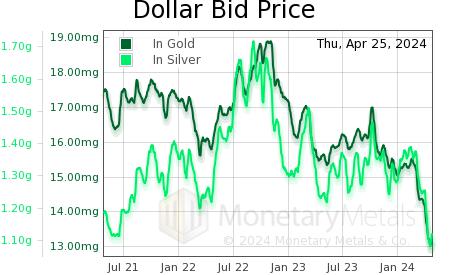
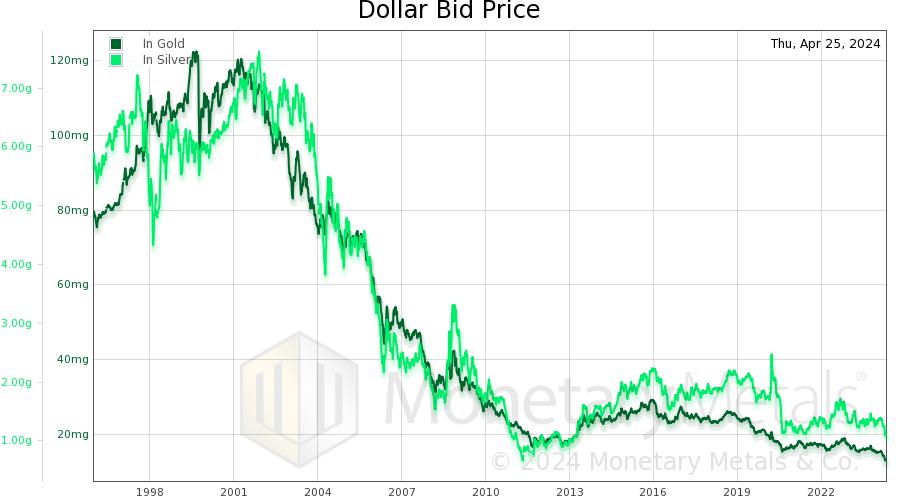
Monetary Metals® argues that gold is the objective measure of value, against which everything including dollars, must be measured – it is dollar that is rising and falling in value against gold (and silver). This chart shows the price of a US dollar in milligrams of gold and grams of silver.
3 Month Chart of Dollar Prices
 .
.
3 Year Chart of Dollar Prices
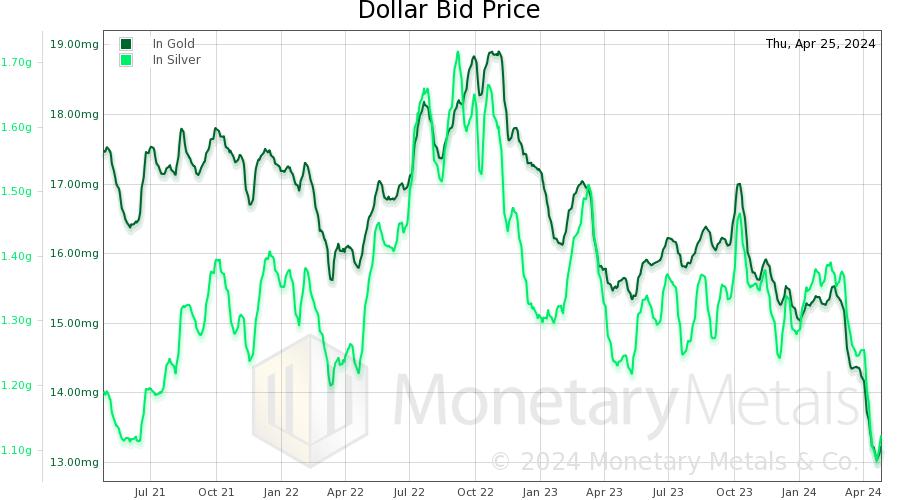
Max Chart of Dollar Prices
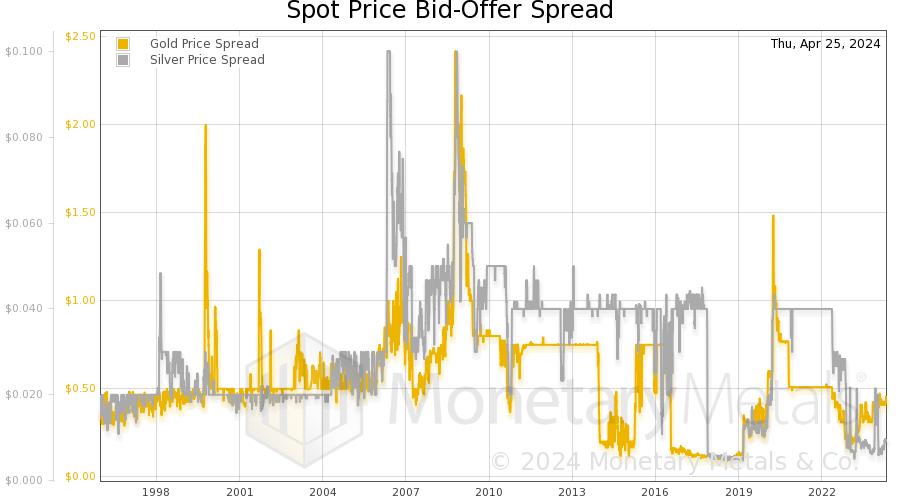
Spot Price Bid-Offer Spread
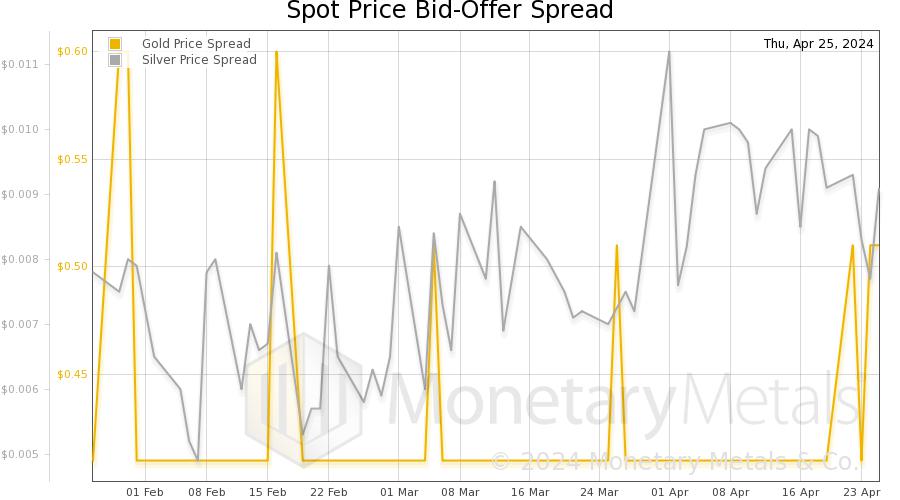
This chart shows difference between the bid and offer price for gold and the bid and offer price for silver. This difference, or spread, can be an indicator of liquidity or stress in the market. When the market is highly liquid, bid-offer spreads may be tight (or low) but during periods of stress or uncertainty, the bid-offer spread may widen (or rise).
This chart is available in durations of 3 months, 3 years and from 1996 to today.
3 Month Chart of Spot Price Bid-Offer Spread
3 Year Chart of Spot Price Bid-Offer Spread
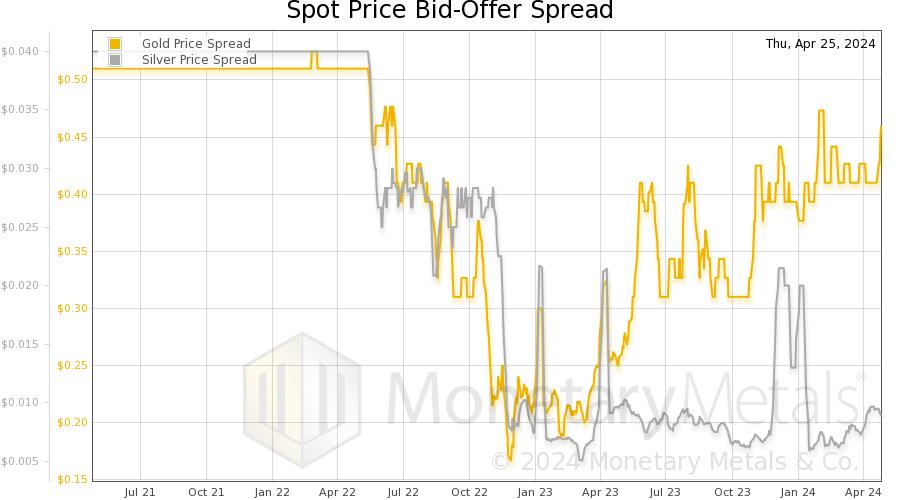
Max Chart of Spot Price Bid-Offer Spread
Gold & Silver Prices
All charts are up to date as of Wed, August 16, 2023.
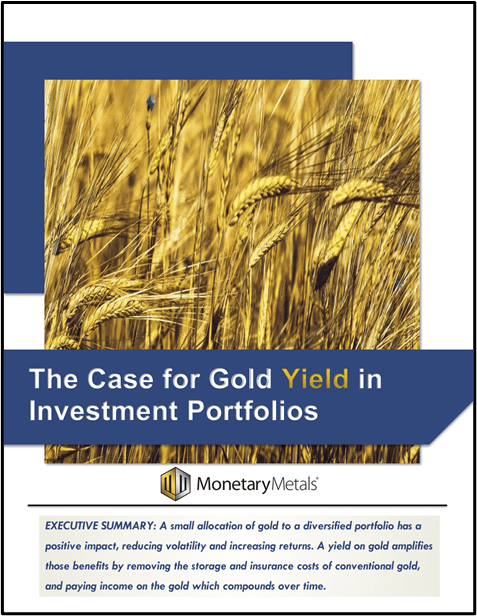
The Case for Gold Yield in Investment Portfolios
Adding gold to a diversified portfolio of assets reduces volatility and increases returns. But how much and what about the ongoing costs? What changes when gold pays a yield? This paper answers those questions using data going back to 1972.
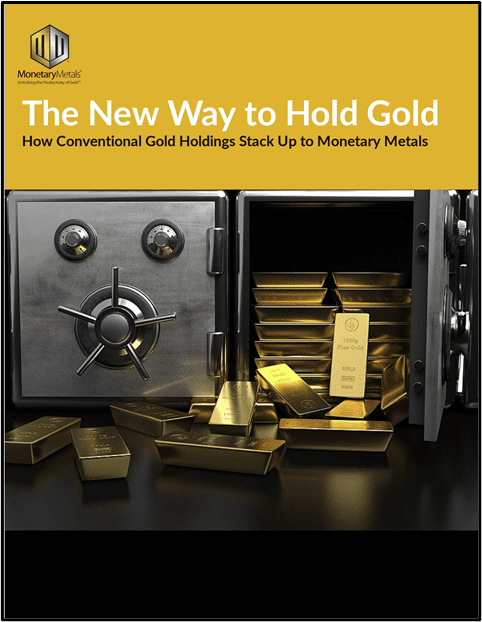
The New Way to Hold Gold
In this paper we look at how conventional gold holdings stack up to Monetary Metals Investments, which offer a Yield on Gold, Paid in Gold®. We compare retail coins, vault storage, the popular ETF – GLD, and mining stocks against Monetary Metals’ True Gold Leases.

