
Gold Demand Falling, Report 15 May, 2016
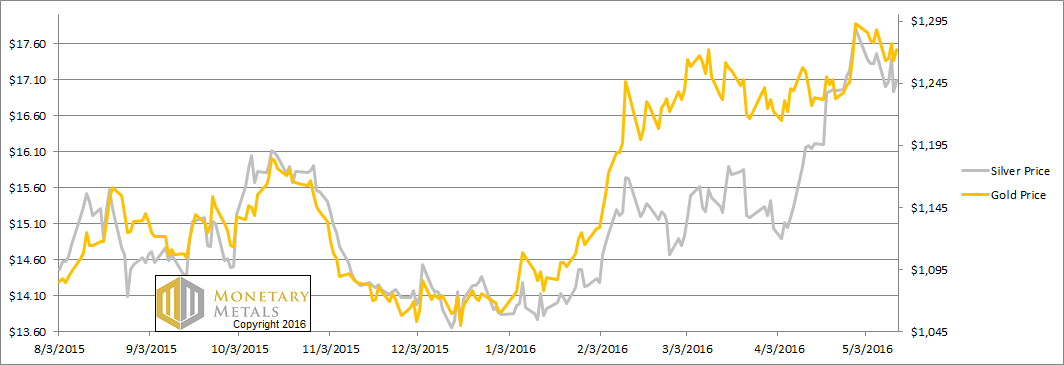
The price of gold moved down about sixteen bucks, while that of silver dropped about three dimes. In other words, the dollar gained 0.3 milligrams of gold and 0.04 grams of silver.
We continue to read stories of the “loss of confidence in central banks.” We may not know the last detail of what that will look like—when it occurs one day. However, we will wager an ounce of fine gold against a soggy dollar bill that it will not look like today with the market bidding dollars higher.
Loss of confidence is just a meme used by gold bettors. What are they using to make their bets? Dollars. What are they trying to win? More of the dollars they say will soon go bidless.
*Achem*
One benefit to looking at the supply and demand fundamentals is that it tells us, more accurately than price action, what confidence in the central banks is really doing. So let’s take a look at that picture. But first, here’s the graph of the metals’ prices.
The Prices of Gold and Silver
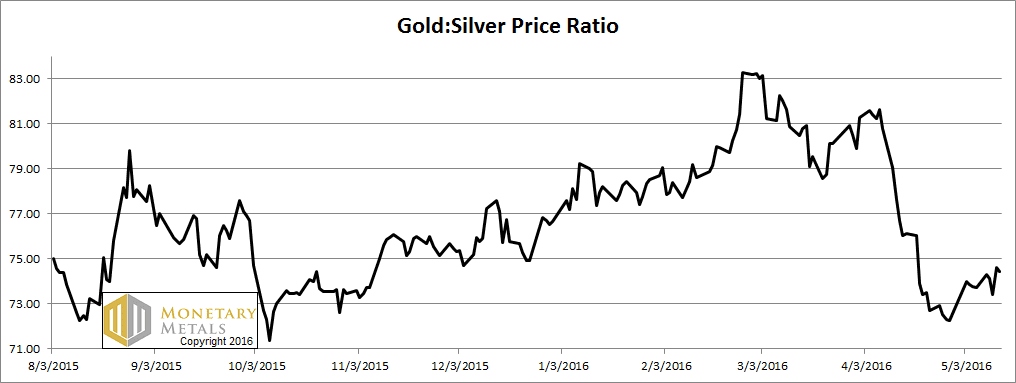
Next, this is a graph of the gold price measured in silver, otherwise known as the gold to silver ratio. The ratio was up this week.
The Ratio of the Gold Price to the Silver Price
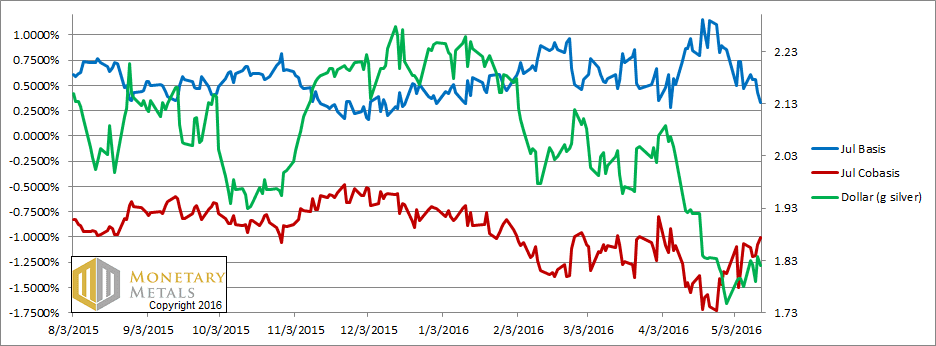
For each metal, we will look at a graph of the basis and cobasis overlaid with the price of the dollar in terms of the respective metal. It will make it easier to provide brief commentary. The dollar will be represented in green, the basis in blue and cobasis in red.
Here is the gold graph.
The Gold Basis and Cobasis and the Dollar Price

The price of the dollar is up (i.e. the price of gold, measured in dollars, is down) and the scarcity of gold (i.e. the cobasis, the red line) is up with it. This is our old pattern. When scarcity follows the dollar price, then it’s just speculators adjusting their positions.
Back to confidence in central banks. We can say two things. One, the fundamental price of gold is down (remember, this is the expiring June contract that is under heavy selling pressure, due to the contract roll, and hence will have a depressed basis and—in more “normal” post-2008 markets, a positive cobasis). It is down twenty bucks, about $40 below the current market price.
Two, confidence in central banks is still humming along just fine. The speculators are betting on gold futures to get more of those allegedly despised Federal Reserve Notes.
When the actual repudiation of central bank paper occurs, no one will want the stuff. Gold owners will no longer think of the value of their gold in dollar terms. Just as the people of Venezuela do not think of the value of their gold in terms of the collapsing bolivar.
Now let’s turn to silver.
The Silver Basis and Cobasis and the Dollar Price
In silver, it’s the same pattern as gold.
Our calculated fundamental price of silver dropped almost a buck. It’s now nearly two bucks below the market price.
In silver, even more than in gold, many speculators who do not question the validity of the dollar also do not question that silver is going up, and hence a great way to make some more dollars.
We now calculate a fundamental on the gold-silver ratio over 81.
© 2016 Monetary Metals

By losing faith in central banks is not “believing” what the central banks want them to believe ie rising short term rates in the future for example, or succeeding in making consumer prices higher.
That does not mean speculators are throwing usd, eur or yen…
In the meantime, happy to see that short gold and silver re-appear…
It’s “ahem” ya big dummy. :-)
As if on cue, speculation that gold is overvalued by $40 (big whoop) has caused another rally.
Isn’t it true that nobody knows the next tick of the market? If that’s true, speculation that the gold price is undervalued or overvalued is just that, speculation. The price of gold is simply the price of gold. We might attempt to calculate its value according to a particular metric, but other investors, traders and speculators are using their own metrics. And each of those groups has the power to move markets, at least temporarily. Besides, there are times when a particular approach to a market is plain wrong. Markets can be fickle things. I remember selling gold at $450 before it went to $225. Unfortunately for me it went to $850 first.
Technically, gold has held the $1260 support on two occasions, a level mentioned weeks ago. Until that support breaks, odds continue to favor the uptrend…. eventually. It’s also true the market has needed a rest and it appears to be doing just that by consolidating, preparing for another attack on the 2015 highs at $1308 and $18.50. At least that’s the bullish interpretation of recent events.
Since many are pointing to high levels of speculation evident in the COT as a sign of a top, I submit the following from Steve Saville over at http://www.speculative-investor.com.
The two main weaknesses of the COT data
The weekly Commitments of Traders (COT) report is a sentiment indicator, because it gives clues as to what speculators in the US futures markets are thinking by showing how they have collectively positioned themselves. It is nothing more and nothing less. Furthermore, in some markets the COT report is more useful as a sentiment indicator than in other markets. In the gold market it is very useful, although it has two important weaknesses.
The first weakness applies to all sentiment indicators, which is that there are no absolute benchmarks. For example, the level at which the COT data indicate a ‘dangerous’ level of speculative optimism will tend to be much higher in a bull market than in a bear market. In the gold market we’ve seen a good example of this over the past 10 years, in that the total speculative net-long position oscillated within a higher range during 2006-2011 than during 2013-2015. Also, the surge in the speculative net-long position over the past few months could be explained as a step from the bear-market range of 2013-2015 to a new bull-market range, an implication being that the level of that tended to coincide with price highs during 2013-2015 could coincide with price lows during 2016-2017.
A chart illustrating the points made in the above paragraph is presented in the “COT Charts” section below.
(Since this website can not accommodate user submitted graphs, the following links are for your edification:
http://screencast.com/t/55wKGGll
I also encourage you to visit the excellent website, http://www.sharelynx.com, the source of these charts.
The second weakness is the shortness of the historical record. In particular, there are no COT reports for the bull market of the 1970s or for the first few years of the 1980-2000 bear market, and even if the reports did exist they probably wouldn’t be useful because the gold futures market is so much larger in both absolute and relative terms now than it was back then. In COT terms we therefore have nothing to compare the 2001-2011 bull market with and very little of relevance to compare the current situation with.
Related to both the benchmark issue and the shortness of the historical timeframe issue is the fact that the structure of the market has changed over the past 12 years due to the advent of gold ETFs. We think that the influence of gold ETFs is generally over-estimated, but it is undoubtedly the case that some trades that would have been done using gold futures are now being done using gold ETFs. So, although the trading volume and open interest in the gold futures market is much higher now than it was 15 years ago, it would probably be even higher if not for the ETFs.
COT Charts
The Commercial net position is the inverse of the total speculative net position, so when we wrote above that the total speculative position oscillated within a higher range during 2006-2011 than during 2013-2015 we could have written the Commercial position oscillated within a lower range during 2006-2011 than during 2013-2015. This is illustrated by the following chart from Sharelynx.com, on which we’ve enclosed the bull-market range in a green rectangle and the bear-market range in a red rectangle. Note that to account for the increasing size of the futures market, this chart shows positioning as a percentage of open interest (OI).
As mentioned above, this year’s surge in the total speculative net-long position (and the offsetting surge in the Commercial net-short position) could be explained as a step from a bear-market range to a bull-market range.
The next chart (also from Sharelynx.com) illustrates the increasing size of the US gold futures market. Prior to 2002 the net positions of speculators and Commercials never got significantly higher than 100K contracts and the total OI always peaked at around 200K contracts, but over the past 10 years the net positions got as high as 300K contracts and the OI peaked near 600K contracts. In rough terms it is therefore fair to say that the current size of the US gold futures market is about three-times what it was 15 years ago.
http://screencast.com/t/W6kK2H38ZUo
The second of the above charts suggests that speculative bullish positioning is presently close to an all-time high, while the first of the above charts suggests that speculative bullish positioning is presently not quite as extreme as it got during 2006 and 2009-2010.
Current Market Situation
From the 11th May Interim Update:
“…the current level of speculative positioning creates sufficient downside risk that the short-term risk/reward is neutral at best, but there is nothing to say that the amount of speculation won’t rise even further and cause the price to move well above last week’s high prior to the start of a meaningful decline. At least, there will be nothing to say that as long as trend-defining support levels continue to hold. In this regard it has become clear that $1260 is the most important nearby support level.”
The gold market re-tested support at $1260 on both Thursday and Friday of last week. The support was again able to hold, thus keeping alive the possibility of new highs for the year prior to a multi-month top. However, the rebound from support wasn’t strong enough to indicate that a rally to new highs for the year has begun.
Gold’s true fundamentals remain mixed
The most bullish fundamental driver at this time is the real US interest rate, which is represented on the first of the following charts by the reciprocal of the TIPS Bond ETF. The real interest rate made a new low for the year last week and is testing the 2-year low made in January-2015.
The most bearish fundamental driver is the US yield curve, which is represented on the second of the following charts by the 10year-2year yield spread (YC2YR). A declining 10yr-2yr yield spread (a flattening yield curve) is bearish for gold because it indicates either declining inflation expectations or increasing willingness to take risk via borrowing short to lend/invest long.
The yield-spread had risen (the yield curve had steepened) during March-April, but last week it plunged to its low for the year and is close to making a new 8-year low.
http://screencast.com/t/mfWgQIuGhpi
http://screencast.com/t/6RAeyKxj
_______________
P.S. You have to love Trump’s comment about defaulting on U.S. debt. ‘There’s never a need to default’ he assured us, “we’ll just print the money”. And indeed he will. For a man racking up an impressive amount of “Pinocchio” awards, that’s probably the most believable thing he’s ever said.
“The ratio was up this week.”
At the time of writing at the weekend the following statements would also have been true:
“The ratio is down over the past month.”
“The ratio is down over the past two months.”
“The ratio is down over the past six months.”
“The ratio has been rising slowly, having previously plunged from the low 80s to the low 70s. The vector average of these two velocities indicates a downtrend.”
If you are going to bother commenting on the behaviour of the ratio, now that it is disobeying “fundamentals” so persistently.
Agree. The significance of a rising ratio, at least to me, is it’s use as a short term indicator. Silver is obviously the weaker of the metals here. That’s why in my recent hedges (i never go naked short gold — out of respect) I have favored silver shorts.
Again this morning (Monday, the 16th) it appears that consolidation is still in force. I’m guessing that PM’s may even close down for the day. Regardless, the next attempt to break $1260 might succeed. This week is pivotal.
Odds for gold to break is nearly zero. This comex morning action tells us that rising over 1300 is just forbidden.
Breakdown is certain (more than 99%), nothing related to fundamentals or such physical demand and supply BS, just paper going from one hand to another, in the casino called economy or capitalism in its near terminal phase.
Some are viewing the coming huge financial crisis like the collapse of rome. They just forgot that the barbarians were the romans and not the invaders and that rome fall was not the end of the world but just a rebirth.
Hopefully it will be the same this time !
The population in Rome went from over 1 million to less than 1,000. Just imagine that happening to a major city near you.
Yes, “rebirth” indeed. Because almost everybody else died.
Feodalism was a much better than slavery, even for from perfect or even good. People in rome was idle, produced nothing, and relied for land conquered and slaves.
It is not because big cities will be empty that it will be the end of the world, big cities are the cornerstone of capitalism, built on cities/country oppoisition and are like an open air kolkhoze.
How strange that some who are ranting against modern state are so supportive of the old ones or current land organization.
btw, i do agree there’s a lot of churning of money these days, chasing this or chasing that.
Haven’t had pure capitalism for almost 100 yrs. It’s been corporatism, government sanctioned monopoly, etc. But I agree, it’s nearing the inevitable end.
So the music stops, where will you be sitting?
Capitalism in the libertarian way can exist in thoery but not in reality (or within a very short time frame).
Current capitalism IS the fate of the capitalism and the only one, it is not a mistake or because rockfeller or CIA are full of bad guys.
I have written so many times but the salvery production mode, feodalism had a birth a rise, a fall and a death, it is just the capitalism turn.
The reason is in increasing productivity because due to competition (to produce always faster ie for less), more and more humans are just sub productive and put idle while human labour is the cornerstone and creates capital.
Therefore, there will be a moment where this internal contradiction will not find a new solution to postpone (universal income, debt explosion, new markets like africa or ex ussr countries).
On current capitalism when something has not happened anywhere in the world for centuries, it means that it had not to exist…
One more thing. I love it when somebody says “zero percent chance” and stuff like that. No offense… I do it myself sometimes. But it’s typical when a point of view becomes readily accepted and widespread, which is dangerous.
If that’s the case, and i’m kidding on the square, we should actually consider going long on this “dip” (granted, it could get a little better) because it’s rare when consensus thinking makes money on a short term basis.
You see, I thought the consensus was generally bullish, too bullish actually. What you seem to be saying is that short term consensus thinking is bearish.
Is that right… are most of us thinking $1290 – $1300 is now a brick wall? Show of hands please!
If you post is answering mine, I would just add that zero is not exact indeed, it means low/very low odds in the near term (1% or less).
Everything is possible on the longer term.
It looks that 1300 is their line in the sand as I guess computer are programed for a new buying program in case this resistance would be broken out.
Today just told me that comex is stronger than everything else.
bbartlow: I try to remind readers every once in a while that a fundamental is not a prediction for the next market tick.
I totally get it, and to your credit you have made that exact point. On the other hand the apparent attitude towards speculators seems very antagonistic, as if they deserve to be punished.
My view is that efficient speculators will be rewarded for providing liquidity and value to the marketplace. If they are not efficient speculators, they will soon be out of the business anyway.
Getting back to models, if a model isn’t applicable for trading purposes what is its purpose? If it’s just a general heads-up, as in a big picture tracking model, I’ll buy that. Definitely.
I’ll buy that especially if we also recognize — as you seem to — that the markets will always deviate from these attempts to confine it to pre-defined formula. Witness, for example, the regularity of 3+ sigma events; occurring much more often in real time than they should based only on math. Markets, if would seem, defy prediction because one of their chief components is human emotion, combined with varying degrees of leverage…. both creating situations where the markets take on a life of their own.
By the way, I do appreciate your concern over the current situation in gold. To me the alarm bells won’t officially go off until gold breaks $1260, at a minimum. Regardless, it’s hard to believe all those who own June gold futures will be making instant money.
You see, I’m a cynic too. :-)
Short term, the move above $1282 seems to have been nothing more than technical follow through from Friday’s closing strength. Once the New York markets opened today, however, the ability to hold over $1282 was non-existent. We seem to be stuck in a trading range between $1260 – $1282 +/-. To me, what’s needed is not an immediate rally but a move back to your calculated Fundamental Price +/-, which I have capitalized given its significance in this publication.
Be sure to let us know when it’s safe to buy again. ;-)
P.S. Sorry to hear about Arizona. Bastards.
bbartlow: ” if a model isn’t applicable for trading purposes what is its purpose? ”
Trading models offer a virtual foresight, and of course that’s very good, until it isn’t. Models generally are meant to explain what’s modeled–hopefully to summarize noisy data and identify trends and some rationale which drives a trend. For a stock, fundamental analyses consider how the business is operating. For gold, it’s much harder to understand what constitutes fundamental value (indeed, over a century of economic debate turns on the question of how to value money).
Arguably Keith’s undisclosed system here is a hybrid of technical and fundamental analyses. But, assuming it takes basis and cobasis as inputs, it incorporates some measure of speculative foresight. For those of us in a hoarding stage of life, a model like Keith’s is a timing model, rather than a trading one. It may not find us the absolute lowest conversion rate, but it is important to be able to find local extrema where dollars are inarguably overvalued relative to gold.
Depending on one’s final goal, and willingness to risk some portion of a hoard, you could use a fundamental indicator to trade, and perhaps there will be a volatile stage as part of the fiat endgame. In its short lifetime, Keith’s index has seemed to correlate with the number of popular articles questioning central banking that make it into the MSM, so I think he’s right that it quantifies the shifting sentiments about what money is likely to become. Few people outside the Fed can forecast what they may say or do to affect this sentiment. No one inside the Fed seems to have a very clear handle on this either. It is a system stuck in a hubris-dependent rut.
Where I feel Keith’s analysis can help is to encourage the kinds of trades, and their timing that act as a true cost to the central banking system. The world believes (as Trump said) that they can “print more” money, i.e. that their actions are costless. We know that is wrong, and so long as their power derives from that incorrect view of reality, they are stuck like the BoE trying to support a valuation in the face of repeated betting from our side that they must surrender someday. Unlike the famous Soros bet, ours is a frictional effect, designed to extract the real cost of centrally-planned money. If they’re right that they can keep going forever, then we still eek out a living at their expense. If they’re wrong, we’re the ones counting our hoard in gold and therefore likely to end up holding the purse when the banks hold everyone’s bad debts.
Spot Gold
This is supposed to be the price for immediately deliverable physical gold.
There is evidence to suggest that this price could be calculated much differently in the future than it has been in the past. Does this price measure what it is intended to measure, and will it do so in the future?
Much of the info below is from Paul Mylchreest’s report here:
http://gata.org/files/MylchreestReport-05-2016.pdf
He borrows heavily from prior research from Ronan Manly of Bullion Star, who build on previous work by someone you may be familiar with.
A January 2013 Reserve Bank of India Report concluded that the non-physically delivered gold trade dominated the physical gold trade on a 92:1 ratio.
The non physical trade was dominated by
– Unallocated gold accounts created by LBMA members in London; followed less by
– Futures and options contracts on COMEX in the US
– Unbacked ETFs or ETFs with unsatisfactory prospectuses/disclaimers
– OTC derivatives
Only around 5% of gold traded on the LBMA is settled in Allocated accounts. 95% of “gold trading at the LBMA is in Unallocated gold.
Holders of unallocated gold accounts are unsecured creditors of the bank with general claims on an unspecified volume of gold in the bank’s vault.
Research has shown that this amount of unspecified volume of gold in the LBMA bank’s vault underpinning the unallocated gold trade has been steadily declining since 2013.
Gold in London in June 2015 = 6,220 tonnes
Less Gold held by London based ETFs = -1,281 tonnes
Less Central bank gold stored at BoE = -4,570 tonnes
Less Net UK exports since June 2015 = -430 tonnes
Gold “float” deficit = -61 tonnes
From the data above, the researchers calculated that there is a deficit of gold in regards to claims by ETFs, Central Banks, and individual holders of Allocated gold and Unallocated gold.
There is no gold float supporting more than US$200 Billion per day of trading of unallocated gold In London.
“We think that central bank gold lending/leasing might be maintaining the apparent status quo in the London Bullion Market. Rather than being lent to the market to provide liquidity, central bank gold loans/leases are probably being expanded and rolled over to preserve the illusion.”
Any net shift in trading volumes into a more efficient physically delivered market (such as the SGE maybe?) could eventually have an outsized impact on physical premiums versus non physical derivatives and unallocated gold. Cash settlements of bullion bank obligations, delivery/exchange failures and a rapid revaluing of “spot gold” could all be a possibility.
When all of these market participants who thought they “owned gold” realized they do not, guessing where the gold price would go is a big wildcard.
Would basis analysis predict this price move, or simply adjust in reaction to it?
Regarding the Reserve Bank of India Report 92:1 meme that seems to be getting a lot of repeats recently, see http://goldchat.blogspot.com.au/2014/12/reserve-bank-of-india-921-meme.html
While I helped Ronan, Koos and Nick Laird in the research on likely physical stocks in London (which you rightly note Paul “borrows heavily”), I am cautious on taking that analysis too far, as it was based on a number of assumptions. The fact is that the bullion banking system has not failed even though many have been calling for its “imminent failure” for years (and I have accumulated an extensive collection of those claims). If the bullion banking system is as “leveraged” as some claim and the physical stocks are as low as claimed, then it is not possible for it to have continued for as long as it has.
There is therefore something wrong in this analysis, although you won’t see its proponents acknowledging this. I made an attempt at explaining where they went wrong in my “Why the bullion banking system hasn’t failed, yet” presentation at Mining Investment Asia conference in Singapore recently.
I have plans to turn that presentation into a series of articles/youtubes. The bullion banking system is not immune from failure, but it is more robust than many think.
http://www.guillermobarba.com/mleikengroupbrands-net/
It looks that fekete still refuses to learn about more about something else than money…
“somehow, people will feel it in their system – that something very drastic is happening and they will react basically in two ways.”
“that has the effect of the option premium or call option premium, in the gold market, go higher and as it does – a trading or selling of gold call options will be very profitable.”
“There is also another aspect of this, as I say, the coming revaluation of gold is casting a long, long shadow ahead, is just the opposite – namely, people who already have the gold – a lot of people, including governments, central banks, industries, individuals, pension funds etc. – they already have the gold but they are afraid that this value that they already have is exposed to possible setbacks and therefore they want to protect or ensure this value – they will want to sell put options. This means that there is a pent-up demand for put options and therefore selling put options is going to be very valuable. So, to cut a long story short, I would like to describe the coming revaluation of gold in terms of trading call options and put options – in part, selling call options by those who want to earn a capital gain and selling put options by those who want to protect the value they already have accumulated by virtue of the coming revaluation.”
“Now, what does that mean in practical terms? In practical terms, this means that the successful self-protection against these cataclysmic times – which the coming revaluation of gold is going to bring – is not buying low and selling high or selling high and buying low, which is the traditional approach – but it is trading gold call options and put options, basically selling call options and put options.”
that’s his call. profitable in frn’s till the thing blows and probably what Keith and co are up to or some variation thereof.
jham: in our Fund, we do not touch paper at all. It is only bars of physical metal.
Turn of 2016.
Analysis Ag: price above fundamentals. Bearish.
Result: rapid, sustained price rise.
Not a short-term disparity followed by return to fundamental but sustained move in the opposite direction inconsistent with any fundamental indicative power.
March 2016.
Analysis ratio: ratio below fundamental. Bullish.
Result: rapid, sustained decline in ratio.
Probable interpretation as above, but not inconclusive yet.
Conclusion:
– the “fundamental” indicator does not lead Ag price in 2016.
– the “fundamental” indicator is unlikely to lead the ratio in 2016.