 :
:
The price of gold moved down slightly this week, while that of silver dropped more substantially—1.9%. We don’t see much decrease in the enthusiasm yet from this minor setback.
This was a shortened week due to the May Day holiday outside the US.
Let’s look at the only true picture of supply and demand fundamentals. But first, here’s the graph of the metals’ prices.
The Prices of Gold and Silver

Next, this is a graph of the gold price measured in silver, otherwise known as the gold to silver ratio. The ratio was up over a point this week.
The Ratio of the Gold Price to the Silver Price

For each metal, we will look at a graph of the basis and cobasis overlaid with the price of the dollar in terms of the respective metal. It will make it easier to provide brief commentary. The dollar will be represented in green, the basis in blue and cobasis in red.
Here is the gold graph.
The Gold Basis and Cobasis and the Dollar Price

We had to expand the range of the basis axis. The basis ended the week up, and cobasis ended down. However, those spikes on Wednesday are really remarkable. It may just be a one-off event (though even that raises some questions about liquidity).
Our calculated fundamental price is up a few dollars, but it’s still more than $40 below the market price.
We just are not seeing the driver of a bull market in gold. Does that mean the price couldn’t rise further, driven by speculative greed? No, of course not. It just means that the supply and demand fundamentals are weak, as weak as we have seen them in years.
As recently as the first week of March, gold was selling at a $200 discount to its fundamental. Supply and demand conditions have eroded, and recently the market price has risen above this lower fundamental.
Now let’s turn to silver.
The Silver Basis and Cobasis and the Dollar Price
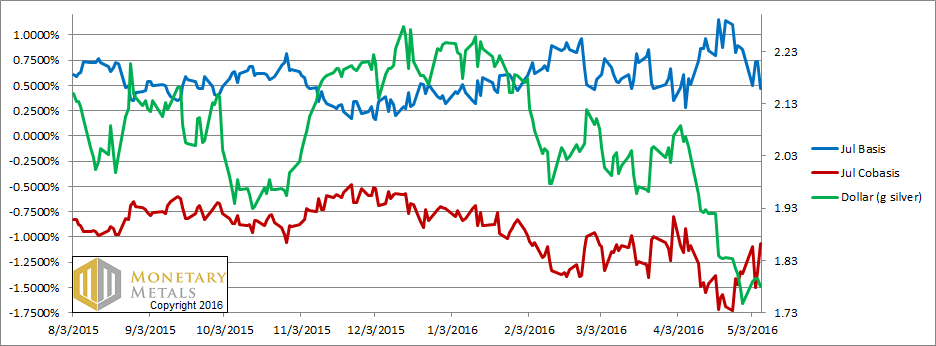
In silver, the price is down and the abundance (blue line) is down.
It does seem a bit anomalous that silver is showing relatively less weak fundamentals than gold. We shall see if this trend has legs.
Unsurprisingly, the fundamental price of silver went up. It’s now only $1.50 below the market price.
The fundamental gold-silver ratio is 78.
© 2016 Monetary Metals


“silver is showing relatively less weak fundamentals than gold.”
That is perhaps as close as we are going to see to “irrational exuberance”.
With substantial price weakness today on a strong Akshaya Tritiya, we will at least not be seeing the forbidden words “Gold/Silver prices were strong today due to robust support from demand for physical metal in [India/China/country x]…”
Model and price are converging. If they diverge again in the opposite direction, perhaps the model will finally call the trend change.
http://timesofindia.indiatimes.com/business/india-business/Muted-response-for-gold-sales-on-Akshaya-Tritiya/articleshow/52195232.cms
“NEW DELHI: High gold prices dampened sales on Monday on Akshaya Tritiya, considered auspicious to buy yellow metal, with a section of industry players putting the sales figure 20-30 per cent lower than the year-ago level.”
Historically this is the typical Indian response following a strong price rise. Let’s see if Keith’s model predicts the turnaround I expect in the second half of 2016, before the import/export data confirms it for Indian/Eastern flow.
The dollar is “up” slightly today:
May 9, 2016
USD is 24.623mg of gold
1263.165 (spot bid)
19:47:40 EST
1264.90 (future ask)
-$1.735 (difference on decarry)
-0.824% cobasis
1263.355 (spot ask)
19:47:40 EST
1264.70 (future bid)
$1.345 (difference on carry)
0.639% basis
I wonder if the “fundamental price” of gold went up at those data points or stayed the same.
Pizza Genie, can I ask, how do you get the bid/ask spreads for spot and futures? I really want to pull that data into sql and chart the basis myself, but I don’t know how to get the live data.
Jon
Missed this month old comment. The info is not as easy to find without paying for a data feed. Goldseek.com publishes the spot bid/ask spread with a time stamp on the front page – right now it reads this:
Bid: 1273.72
Ask: 1273.95
Jun 10, 2016 17:00:00 EST
Finding this data for the most actively traded futures contract was even harder, I could only that here on a financial site, esignal:
http://quotes.esignal.com/esignalprod/quote.action?s=GC+3!
That reads:
Gold Aug’16 (GC Q6)
Bid: 1276.20
Ask: 1,277.10
Jun 10 2016 16:59:56 EDT
We less than nimble bulls got kicked in the gut today. COT accurately predicted an overbought market. Whether this market is a genuine bull, or not, depends on NEW market participants. If it’s the same old crowd, including further fund liquidation, reluctance of Indian buyers, Chinese who like to buy in a rising market, et al, then further liquidation is more likely than not.
However, IF new market participants sense that as an investment philosophy, today’s bubble prices for financial assets could be hedged by a relatively small diversification into hard precious metal assets, then this pullback is a buying opportunity.
If I knew the answer to the above conundrum, Carl Icahn would be calling me daily.
I wouldn’t underestimate the scale of dishoarding by the West in the last three years that (temporarily) overwhelmed the introduction of China as a meaningful importer from 2011. In the two years 2009-10 when the gold price advanced 75% from $800-1400/oz the UK, Switzerland and America imported/hoarded on a collective net basis 2600mt by my calculation (round numbers). That’s a similar rate to which China has been importing in recent years. Now if these net-exports from the West have essentially run their course, indeed if the West has reversed course and is pulling gold in again, then we have a very interesting situation developing… because China wasn’t a player in the last bull market.
You are correct on the COT, sir. I had mentioned in last weeks’comments the 300,000 all time high. This high? 295,000.
Thanks also to the BoJ, several momentum readings (like RSI) reached overbought levels too, although a close below structural support at 1260 is needed to help confirm a more extended bearish scenario.
I do NOT like the fact that both metals failed to trade above their 2015 highs, tho it’s too early to say it won’t happen. Yet, if the metals fail to trade above 1308 and 1850 (2015 highs) it leaves the door wide open for new lows eventually. So keep an open mind.
I remain intermediate term bullish (although maintaining a hedge from 1303) until a close below 1260…. and remain long term bullish until two weekly closes below 1150.
Of course, part of me will always be bullish on gold because it’s money, and you will not convince me otherwise.
Those bullish should focus on August gold futures (if you play that game) not June, given the high number of speculative June contracts that are likely to expire underwater over the next few weeks. I see 1220 as the likely downside max if we get rolling. That’s also the area of “fundamental” values as calculated by Monetary Metals. (hat tip Mr. Weiner!)
One way or the other we definitely need to cool the speculative sentiment that has gripped the market. Most healthy advances start out slow, with more rapid advances coming later. This advance seems to have done the opposite, and it worries me. At a minimum the market seems ahead of itself.
Cooling the market down typically happens with either of two scenarios — an extended high level consolidation (back and forth 1260 – 1280 for example) or a correction that starts out slow but culminates with a nasty capitulation that reduces bullish sentiment. That’s the 1220 – 1230 scenario, later in May/early June. If bullish sentiment fails to decline even after a bad break to 1230, i have to believe we’re going under 1200. But we’ll see about that, and take the signals as they come.
One thing seems sure — we’re not going to the moon when everything is positioned for the moon. It just doesn’t work that way.
By the way, I agree with Keith that the current contangos for gold and silver are worrisome, although notably less so for platinum. Also, note that the gold premium over platinum has lessened by $60 recently, an indication that platinum may be the best value. Still, platinum tracks gold and silver, both good and bad news because its future price likely will not defy gravity if gold and silver continue to move lower.
Gold and silver (and platinum) will likely enter a new bull market as reserve banks try to inflate away their debt burdens and resist structural reforms; however we bulls may be too early, or maybe way too early. What we need the most is a modest change of investor perceptions by Mr. Market, coupled with new converts to our point of view.
The rise of the GSR since its nadir with a 71 handle at the beginning of the month is now confirmed to be anaemic. Despite an episode of weakness in both metals it appears to be rising at a rate of no more than a couple of points per month, having collapsed by 10 points in a month. The support line of the old (historical?) GSR uptrend rises by 0.5 per month and will be around 77 or 78 in mid-2016. Should GSR pay a final visit to that support line – after a slow, weak rise – it gives the appearance of “kissing the trend goodbye”. Since mid-year is a seasonal low for gold, that would also fit the seasonal pattern.
So there could be a couple of points of upside to play for, but after the kiss comes the true impulse move DOWN, on the wrong side of which it behooves not the wise to be.