
Dissecting Gold and Silver Prices After Russian Invasion

To listen to the audio version of this article click here.
Russia invaded Ukraine.
It’s only three words, but millions of lives are directly impacted and billions indirectly. We will focus our commentary on the markets.
Market Analysis
At first, it was classic “risk off”: stocks down, other currencies down in USD terms, Treasurys up (i.e. interest rates in USD down), crude oil was over $100, and bitcoin crashed. The price of the dollar in gold terms was down (or gold was up, as normies would say).
From 3am (London time), the price of gold begins to rise from about $1,915. By 11:00, it’s hit around $1,975. Then, apparently the reaction by President Biden was deemed to be “good” (by the standard of looking at the shortest time frames, which is one of the consequences of zero interest rates). And everything reversed.
The S&P rallied 170 points. Oil fell below $92 before recovering a bit to around $95. Bitcoin recovered from its crash over 9%, to end the day well in positive territory. And the price of gold reversed, hitting $1,880 before recovering somewhat to around $1,900.
Gold Market Analysis
The question on everyone’s mind is: was this buying and selling of futures, or buying and selling of gold metal? Here is a graph of the day’s action, showing price overlaid with basis (our measure of the abundance of the metal to the market).
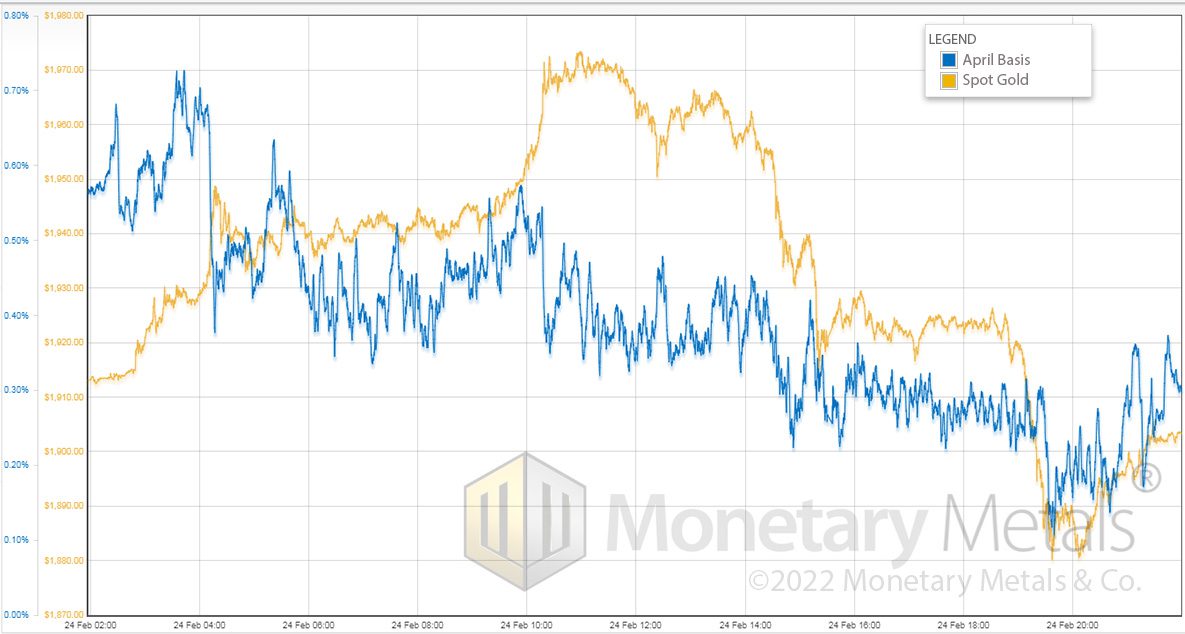
It is very interesting that the gold basis is in a downward trend until 20:00, other than two brief and small bits. Basis, that is abundance, is falling when the price is rising. At the start, when the price is about $1,915, the basis is around 0.6%. By 11:00, when the price is around $1,975–$60 higher—the basis is down to around 0.4%. When the price hits $1,880, the basis is down to 0.1%.
The buying was metal, and the selling was futures. No, not the banks dumping mass quantities of naked contracts to suppress the price. That would have driven the basis to -40% or something. No, speculators selling gold on the “good” news, a bit ahead of the sellers of metal. How far ahead?
Basis = future – spot
Basis fell 0.5%. 0.5% of $1,900 is $9.50. But this basis is for the April contract, which expires in about 2 months, or 1/6 of a year. 0.5% is an annualized number, to get that rate for 2 months means the actual change is 1/6 of $9.50 or $1.58.
The difference between the price of the April gold contract and spot gold fell by $1.58. This is rather more prosaic than the headline screaming “banks manipulate gold down by selling mass quantities of paper!”
But, nonetheless, very significant. Especially because it happened both when the price was rising and when it was falling.
Silver Market Analysis
Now let’s look at silver.
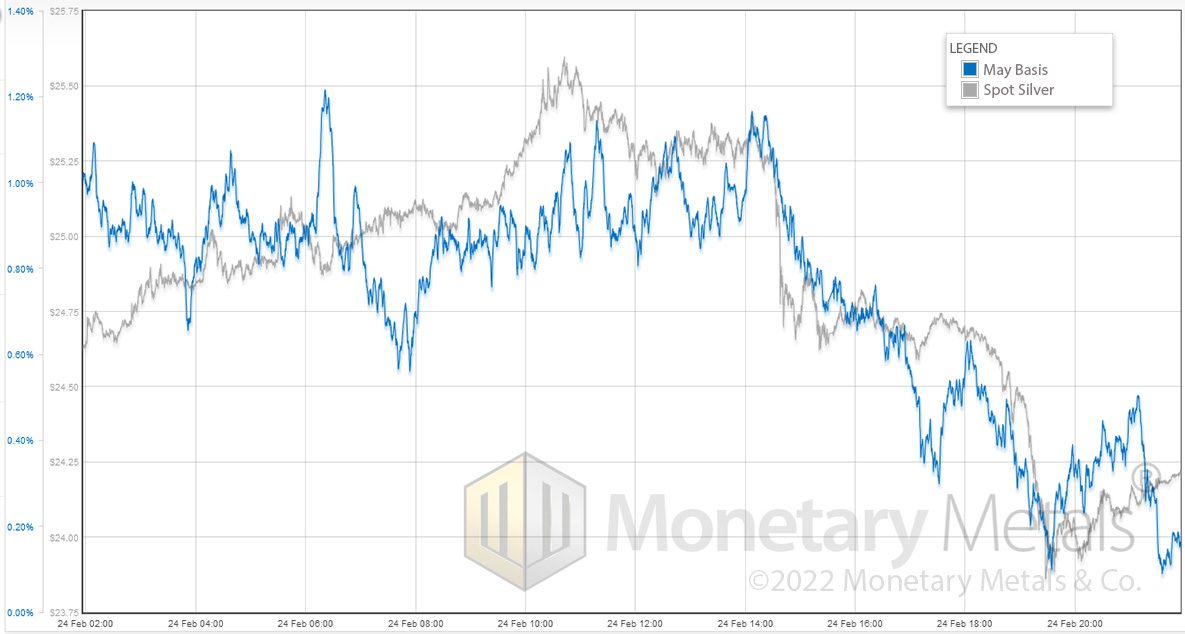
As is often the case nowadays, silver shows a somewhat different picture.
Silver begins the same as gold, and we see rising price with falling silver basis, through around 8:00. This is buyers of metal leading buyers of futures.
But then basis rises with price continuing to rise, through around 11:00. The speculators now have the lead. Then the basis follows the price down, which is speculators selling. Basis ends the day quite a bit lower than it began. That is, silver is scarcer to the market (while the price is lower).
We do not read this as bearish, though we read it as perhaps less bullish than gold’s action.
Additional Resources for Earning Interest on Gold
If you’d like to learn more about how to earn interest on gold with Monetary Metals, check out the following resources:
In this paper we look at how conventional gold holdings stack up to Monetary Metals Investments, which offer a Yield on Gold, Paid in Gold®. We compare retail coins, vault storage, the popular ETF – GLD, and mining stocks against Monetary Metals’ True Gold Leases.

The Case for Gold Yield in Investment Portfolios
Adding gold to a diversified portfolio of assets reduces volatility and increases returns. But how much and what about the ongoing costs? What changes when gold pays a yield? This paper answers those questions using data going back to 1972.


Leave a Reply
Want to join the discussion?Feel free to contribute!