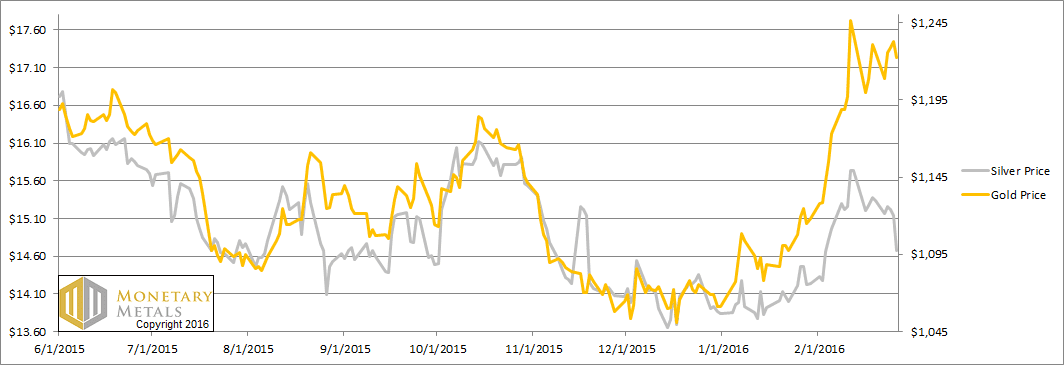
The gold to silver ratio moved up very sharply this week, +4.2%. How did this happen? It was not because of a move in the price of gold, which barely budged this week. It was due entirely to silver being repriced 66 cents lower.
This ratio is now 83.2. It takes 83.2 ounces of silver to buy an ounce of gold. Conversely, it takes 1/83.2oz (about 0.37 grams) of gold to buy an ounce of silver.
This ratio is now within a hair’s breadth of breaking out past the high set on Oct 17, 2008. See the historical graph (based on LBMA silver fix and PM gold fix data, provided by Quandl).
The Historical Ratio of the Gold Price to the Silver Price
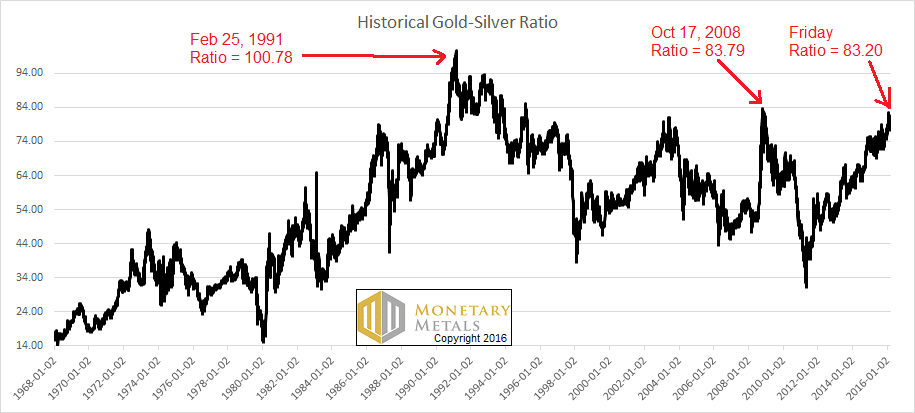
Monetary Metals has been predicting a ratio well over 80 for a long time. And for two months, we have been calling for it to go much higher still. Could there be a correction? Absolutely. Could the fundamentals change? We expect they will—at some point. We will call that when we see it.
Speaking of the fundamentals, read on for the only true picture of the gold and silver supply and demand fundamentals…
But first, here’s the graph of the metals’ prices.
We are interested in the changing equilibrium created when some market participants are accumulating hoards and others are dishoarding. Of course, what makes it exciting is that speculators can (temporarily) exaggerate or fight against the trend. The speculators are often acting on rumors, technical analysis, or partial data about flows into or out of one corner of the market. That kind of information can’t tell them whether the globe, on net, is hoarding or dishoarding.
One could point out that gold does not, on net, go into or out of anything. Yes, that is true. But it can come out of hoards and into carry trades. That is what we study. The gold basis tells us about this dynamic.
Conventional techniques for analyzing supply and demand are inapplicable to gold and silver, because the monetary metals have such high inventories. In normal commodities, inventories divided by annual production (stocks to flows) can be measured in months. The world just does not keep much inventory in wheat or oil.
With gold and silver, stocks to flows is measured in decades. Every ounce of those massive stockpiles is potential supply. Everyone on the planet is potential demand. At the right price, and under the right conditions. Looking at incremental changes in mine output or electronic manufacturing is not helpful to predict the future prices of the metals. For an introduction and guide to our concepts and theory, click here.
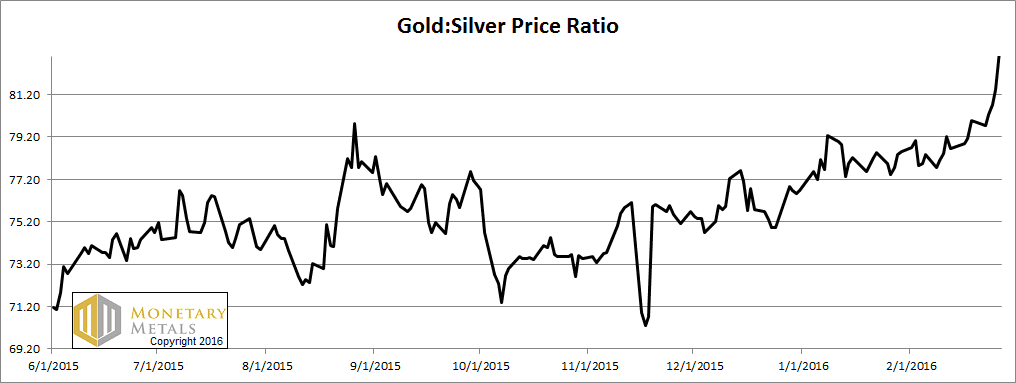
Next, this is a graph of the gold price measured in silver, otherwise known as the gold to silver ratio. The ratio was up substantially.
The Ratio of the Gold Price to the Silver Price
For each metal, we will look at a graph of the basis and cobasis overlaid with the price of the dollar in terms of the respective metal. It will make it easier to provide brief commentary. The dollar will be represented in green, the basis in blue and cobasis in red.
Here is the gold graph.
The Gold Basis and Cobasis and the Dollar Price
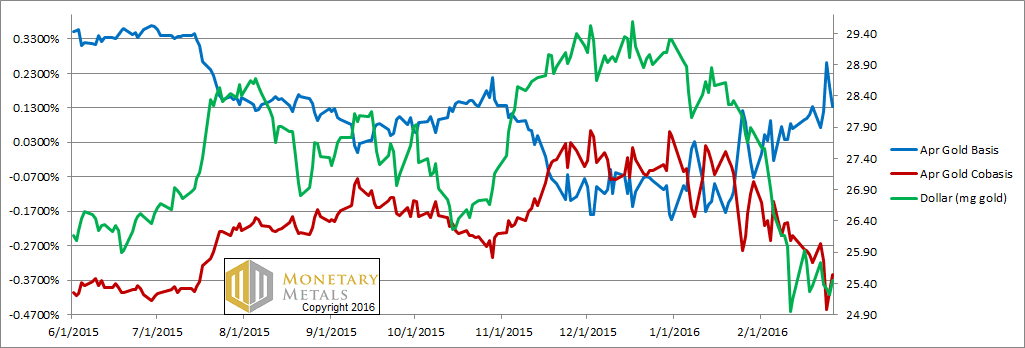
The price was basically unchanged. The cobasis (i.e. scarcity) was also just about unchanged. This, by the way, was also true for farther-out contracts although we only show April in this free Report.
We calculate a fundamental gold price of over $1,440. This is the price we would have if the price effect of speculation was subtracted out of the market. Who would be shorting gold at this point? We have an idea of one group that may appear sacrilegious to the gold community.
Let’s get it out of the way. No, it’s not the Powers That Be, the commercial banks, the central banks, or the Illuminati. It’s the silver bugs. Consider the widespread belief—at least outside of readers of this Report—in silver outperformance. Who doesn’t think the ratio should be far lower—50 for starters, on the way to 16 as in Ye Times of Olde?
How would you trade this thesis? You would short gold futures and go long silver futures in equal dollar amounts. This would of course push up the price of silver, and push down the price of gold
We would say to anyone in this trade to be careful, but obviously they don’t read this Report. If you must trade this trend, you should do the opposite: long gold, short silver (and be wary of violent corrections).
How do we explain that the price of gold is 15% below its fundamental, while the price of silver is only at a 2% premium? The silver market is less liquid than the gold market, so equal dollar values of this trade would push the silver price up more than it would push the gold price down.
We have two thoughts on this. One, if most traders think of the metals as commodities—we saw yet another article on this theme today—and if commodities are in a bear market, then the metals are hated. Perhaps silver would be 30% under its fundamental—i.e. about $10—if it weren’t for this trade that alters the relationship of silver to gold.
Maybe. Our other thought is that if this is a new bull market in gold—i.e. a bear market in the dollar—it’s in stealth mode at the moment. Mainstream traders are not excited about gold speculation. They’re not buying gold futures, and may even be short. We are aware of the Commitment of Traders report (COT), showing that non-commercials (i.e. speculators) have a net long position. It’s the commercials (i.e. miners and jewelers) who have the short position. Perhaps it’s the miners putting on more hedges—i.e. selling more of their production forward. Maybe it’s the reduced forward buying of the gold users.
Whatever the factors, one thing’s for sure. The price of gold in the futures market is sagging relative to the price of gold in the spot market.
Our approach is not based on aggregate quantities. That’s why we don’t stop at the COT data. We look at spreads. Spreads inform us in a way that strict quantity analysis cannot. If you doubt this, ask how many COT analysts predicted the price action in silver or the ratio.
This graph shows the rates we observe to carry gold for contracts in 2016 (i.e. basis).
The Gold Bases for 2016 and LIBOR
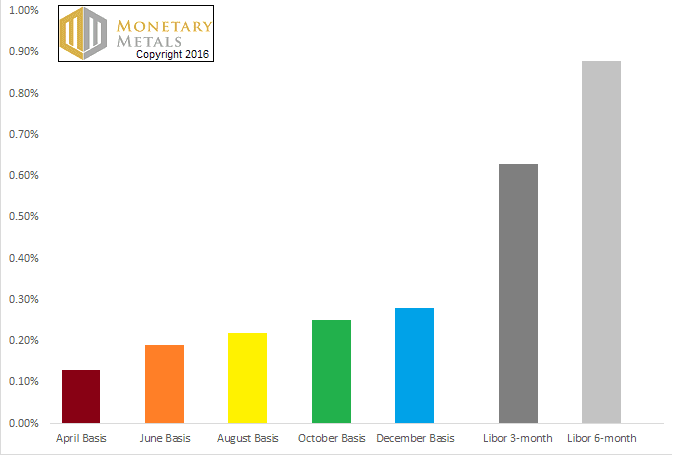
These yields are hardly worth anyone’s while to buy gold and sell a future against it, not to mention that the cost of funding this trade is about twice the return on the trade. Carrying gold does not pay, because gold is not abundant enough in the market to be available to carry.
Now let’s look at silver.
The Silver Basis and Cobasis and the Dollar Price
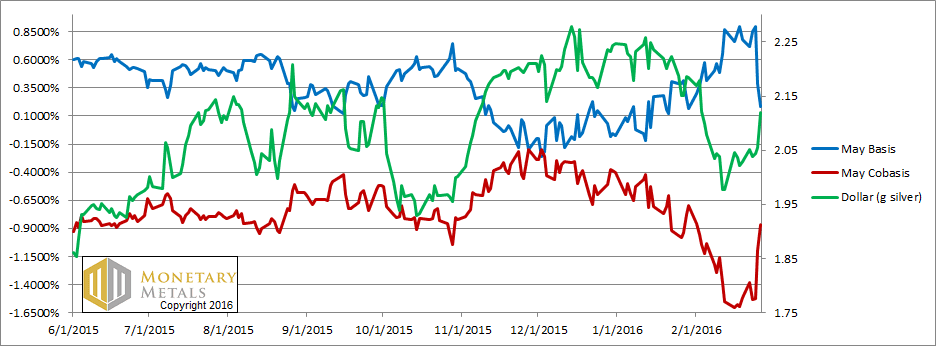
In May silver, we see the scarcity (i.e. cobasis) drops on Tuesday when the price of the dollar falls (i.e. the price of silver rises), and a rising scarcity as silver is becoming cheaper. It’s no surprise that the big rise in scarcity occurred on Friday, with the big drop in price. No question, futures sold off.
Another glance confirms it. Look at the epic drop in the basis. It’s down almost to match the gold basis (though the cobasis is nowhere near what is in gold). To review, here are our definitions:
Basis = Future(bid) – Spot(ask)
Cobasis = Spot(bid) – Future(ask)
The basis is down because the bid on the May contract is being pressed down. Silver—at this price—is no longer so abundant. The basis is well below LIBOR. However, it’s not particularly scarce. The ask on the May contract is still strong, still being lifted by buying pressure.
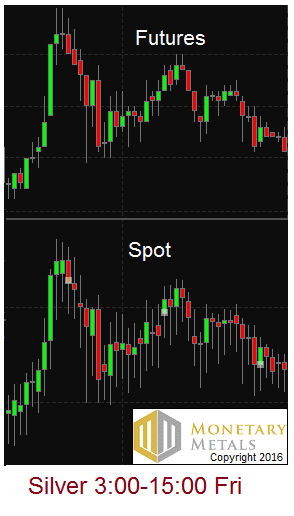
Last week, we showed a picture of “icicles” dripping on the chart of spot silver.
This is in contrast to the futures chart. First, thanks to several folks who wrote to say that these are usually called “shadows”. We used the term icicle because of its connotation of dripping down. We believe that the cause is that metal is being sold, pushing the price down. But then that creates an actionable arbitrage to carry silver. So the market makers buy spot and sell the future. This does two things. One, obviously, it records a trade in the spot market at ask price and lifts the ask. Two, it presses the bid price in the futures market.
If this is correct, then silver is intermittently abundant. At times when there’s selling of metal in the spot market, it’s abundant enough to go into the warehouse. At other times, and we’ll see more of this if the price falls further, it’s not so abundant.
The fundamental price of silver fell about a nickel this week. The market price is much closer to the fundamental now.
This brings us to the ratio. The fundamental on the ratio hit over 100 this week.
What does it mean that the market ratio is just about to break out past its 2008 high, while the fundamental is predicting we could hit the record set in 1991? Ironically, the gold-silver ratio is showing something that most mainstream signals cannot.
The seasonally adjusted unemployment number looks brilliant at under 5%. The S&P 500 index of stocks is only about 10% off its highs from the first half of last year. Sure, there’s that epic collapse in the price of crude oil and other commodities, but pay no heed. Cheap oil means cheap gas which gives money back to consumer who can spend spend spend our way to prosperity.
The gold to silver ratio is showing us that the junior money is getting cheaper relative to the senior money. It is showing us that the metal which has industrial demand as well as monetary is falling relative to the metal whose demand is entirely monetary. It is also showing us that tightening credit conditions are starting to matter. So far as silver is concerned, credit conditions today match those which existed in October 2008.
© 2016 Monetary Metals


 :
:
To me it’s looking like 2008 again. So gsr could surge ‘to da moon’ before turning around sharply.
Looks quite probable except if contrary to 2008, dollar devalues compared with gold (it is the dollar which is rotationg around gold !).
It looks like even Cleveland Fed has noticing something :
http://www.zerohedge.com/news/2016-02-28/three-charts-no-small-cap-asset-manager-wants-you-see
The only question is : is the ratio going well over 100 to 150,200 or more ?
Keith:
What is the macroeconomic basis for assuming there is some relationship between the price of gold and the price of silver?
Post Keynesian economics requires some theoretical basis for computing ratios or relationships.
Gene
Thanks for your comments. I would bet an ounce of fine gold against a ratty dollar bill that we will never see a gold-silver ratio of 150,000. :)
Gene: I am not a post-Keynesian. I am a pre-Keynesian: a Mengerian. :)
I am not fan of what people call “macroeconomics”. That said, you raise a good question that people should be asking more often. On what basis does one divide two numbers and call it a “ratio”?
In this case, both gold and silver are money. That is the basis of looking at the ratio–they are directly comparable, though silver has an industrial component to its demand.
Our good Mr. W is referring to Carl Menger of course. For those interested:
https://mises.org/sites/default/files/Principles%20of%20Economics_5.pdf
Keith,
Great stuff! I have a couple of questions and thoughts. What does the constant devaluation of the yuan play into the prices of PMs? Wouldn’t this also affect the USD’s relationship to PMs? I’m sure that a gold/silver/in yuan chart should look quite different.
Also, there is talk on ZH about the fact that if everyone in the US decides to hoard FRNs that there are not enough of them to cover all of the zeros and ones on the books. This coupled with talk of getting rid of large denomination bills, as Europe is saying about the 500 euro note will surely skew the PM landscape. All of this, including China’s capital controls cannot be adding stability to the PMs market.
Best,
Theo
The yield on Swiss government bonds is negative out to 20 years now. The 30 year Swiss bond yield is at an all time low of 0.126%. Looks like the CHF could collapse soon like you have said.
When you compare both gold and silver as money, usually you add that silver has an added large industrial component to its demand. A similar comment could be made about platinum. Do you also think platinum is money?
Swiss franc will not collapse until the capitalism dies, which will happen one day.
BRICS will do exactly the west did these last decades, exactly the same.
150,000, that’s the gold sand ratio :)
https://www.youtube.com/watch?v=s7YMtI-N7Vw
More Kyle Bass, this time on taking delivery of 1 billion in gold:
https://www.youtube.com/watch?v=hdyqwVEvyfY
Pizza: Platinum does not have high stocks to flows, as silver or gold. I do not think of it as money.
RD: We do not have capitalism. Central banks are irredeemable paper currency are features of Marx’ 10 planks, not of capitalism!