
Happy New Year, Report 2 January, 2017
This weeks is also a short Report, and also a day later than normal, due to the New Year’s holiday. We hope everyone has a healthy, happy, and prosperous 2017!
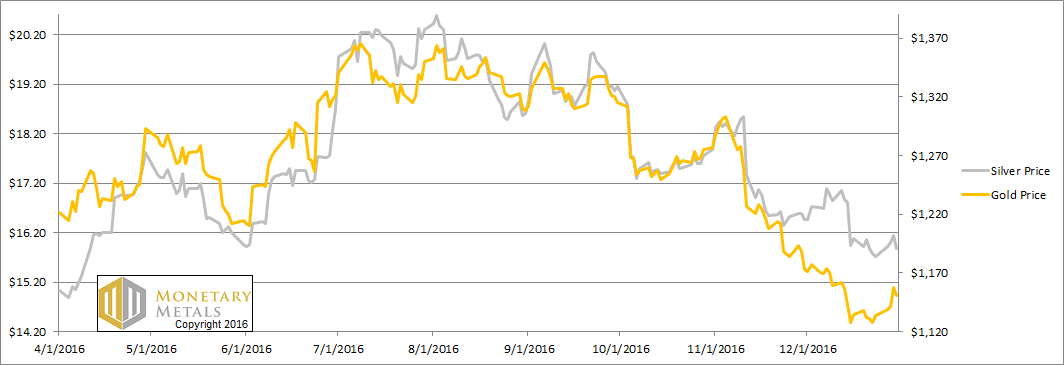
The prices of the metals moved up last week, except for Friday which was a bump in the road, especially for silver.
Below, we will give an update on the supply and demand picture and the fundamental prices. But first, here’s the graph of the metals’ prices.
The Prices of Gold and Silver
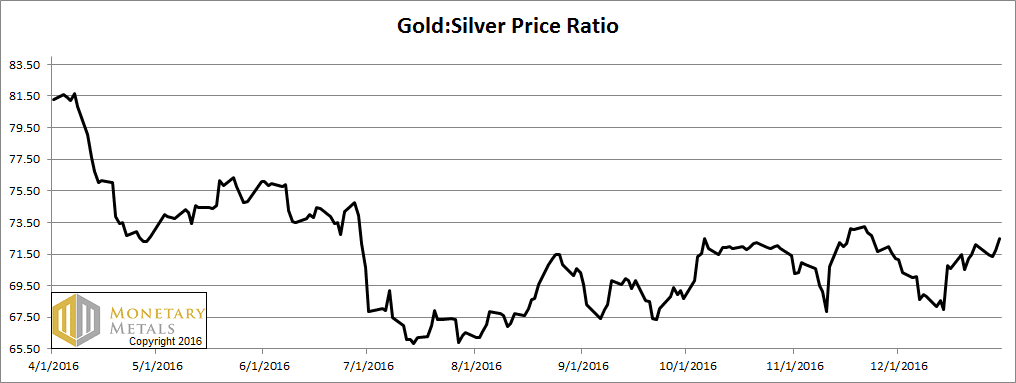
Next, this is a graph of the gold price measured in silver, otherwise known as the gold to silver ratio. It rose further this week.
The Ratio of the Gold Price to the Silver Price
For each metal, we will look at a graph of the basis and cobasis overlaid with the price of the dollar in terms of the respective metal. It will make it easier to provide brief commentary. The dollar will be represented in green, the basis in blue and cobasis in red.
Here is the gold graph.
The Gold Basis and Cobasis and the Dollar Price
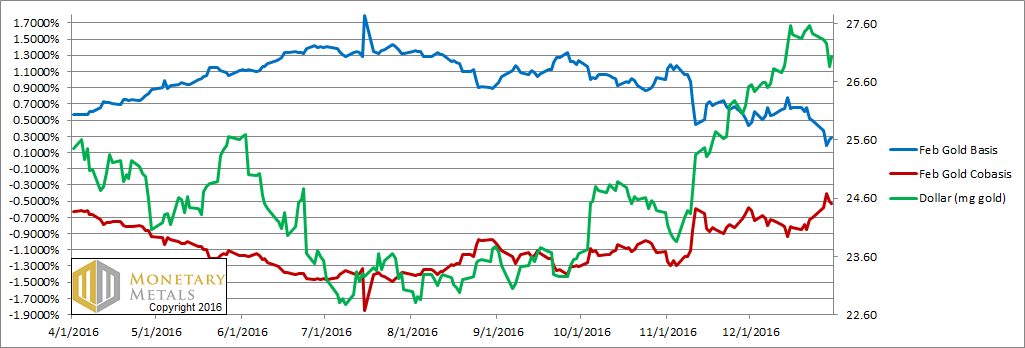
The red cobasis line (i.e. scarcity) rose slightly this week. That’s interesting, because the price of gold was up.
We would be reluctant to read too much into the past few weeks, as the holidays affected many market participants. That said, our calculated fundamental price is up to almost $1,220.
Now let’s look at silver.
The Silver Basis and Cobasis and the Dollar Price
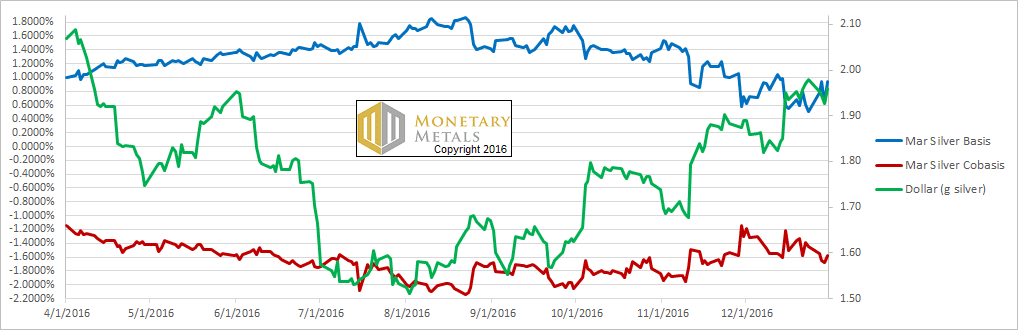
Unlike in gold, we see that silver became less scarce. Its price did not rise as much as gold’s.
Our calculated fundamental price barely moved. It’s still just over $15.60.
© 2017 Monetary Metals
Leave a Reply
Want to join the discussion?Feel free to contribute!