
Intraday Price Analysis, 10 Nov 2017
In this article, we show intraday graphs of both metals for Friday’s price action and provide our analysis of the basis moves.
This is the February gold contract basis plotted with price. Times are GMT.
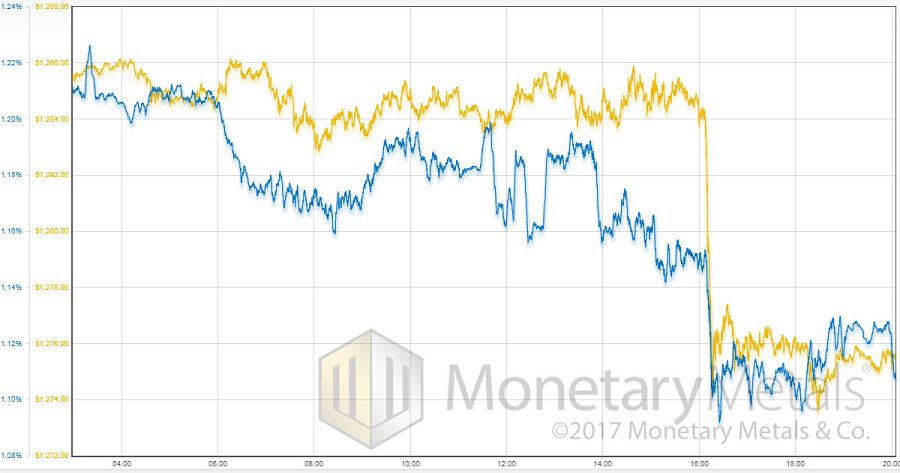
It is interesting how the basis looks like it wants to fall long before the price does. So there is some selling of futures many hours before the price drop. Selling of futures begins at 6am London time. The market is happy to absorb the selling until just after 4pm in London. Then all hell breaks loose. Well six dollars, anyways.
Here is silver.
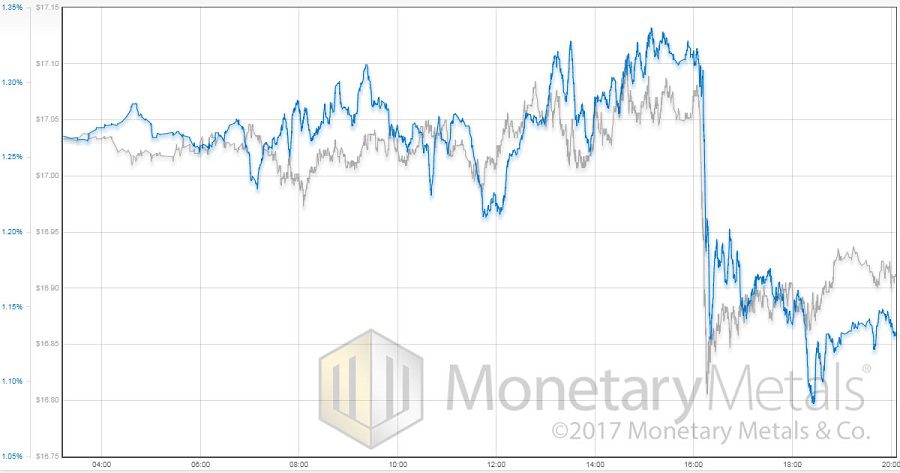
In silver, it looks like the basis wants to rise up until the crash. That means there was selling of physical metal. For example, after about 7am. Or at least a lack of buying of metal on price blips, such as after 2pm.
The metals are similar, yet they move different at times. Friday is one of those times.
© 2017 Monetary Metals


Leave a Reply
Want to join the discussion?Feel free to contribute!