
Intraday Price Analysis, 17 Nov 2017
In this article, we show intraday graphs of both metals for Friday’s price action and provide our analysis of the basis moves.
Here is a graph of Friday’s price action in gold, with the February basis overlaid.
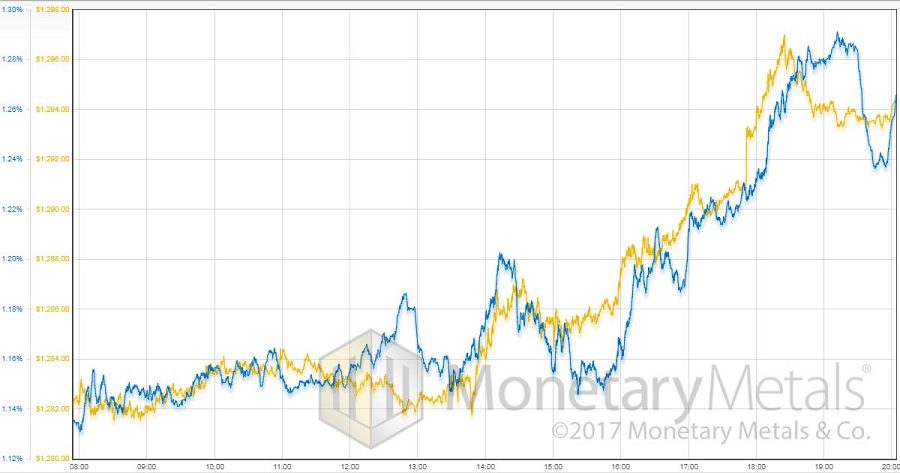
At around 1:30pm (GMT), you can see some buying of futures occurring, but the price does not move, so the basis rises. The speculators were determined, convinced the price would go up. So they fulfilled their own prophecy, and the price begins rising shortly before 2pm. We see some profit-taking starting a bit after 2pm, but the serious buying begins around 4pm.
There is a nice correlation between basis (i.e. spread between futures and spot) and price. This means the buying was speculators, up to their old tricks of using leverage in the futures market. By the way, the basis was pushed up 10% (of its original level), a significant move.
Here is the graph of silver.
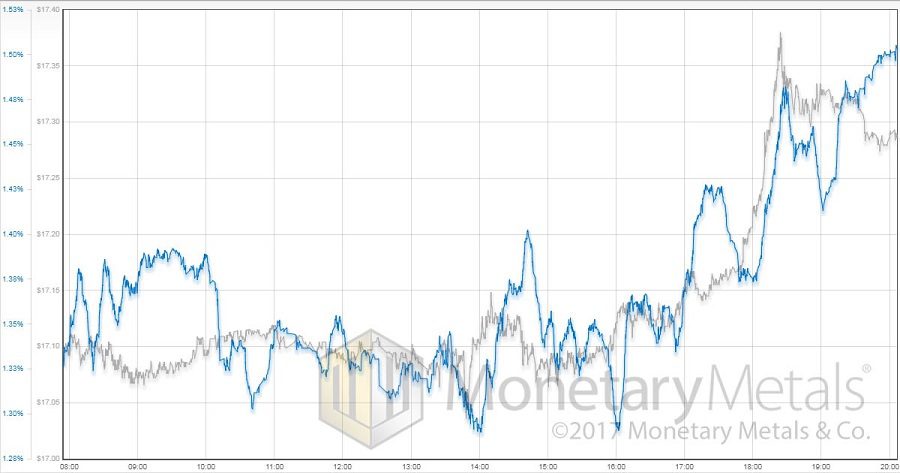
In silver, the speculation began around 8:30am. Then the same trend as gold, and the same correlation and hence drivers.
From start to peak, the silver basis was up 13%.
© 2017 Monetary Metals


Leave a Reply
Want to join the discussion?Feel free to contribute!