
Johns Fleeing a Burning Whorehouse, Report 17 July, 2016
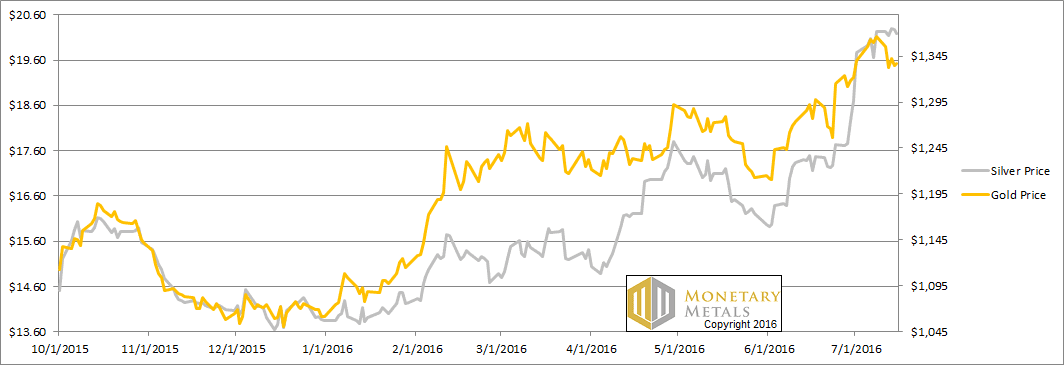
The prices of the metals were down this week, -$29 in gold and -$0.05 in silver. However, the gold to silver ratio dropped another fraction of a point.
Keith was on a panel this week at FreedomFest, when the moderator asked the panelists for their view about the price of gold. Unsurprisingly, this being a panel of Austrian School economists and finance professionals, opinions were expressed and price targets in the $1,500 range for end of year were put out there.
Why is this? It wasn’t based on any sense of supply and demand (though one panelist made the error of thinking supply is only the output of the mines, ignoring the entire rest of the gold stocks accumulated over the past 5,000 years which is all potential supply at the right price and under the right market conditions).
$1,500 is based on the assumption that gold should react to central bank abuses, rising quantity of dollars and other currencies, Brexit fears, etc. Why should it? Are people automatons that simply do what the theory fates them to do?
In our view, that’s not how to look at it. The gold price is subject to rampant speculation. It’s speculation that determines the volatile moves in the price.
Economist John Maynard Keynes got one thing right. In a discussion of a hypothetical newspaper contest to pick the most attractive faces (as rated by other contest entrants), he said:
“It is not a case of choosing those [faces] that, to the best of one’s judgment, are really the prettiest, nor even those that average opinion genuinely thinks the prettiest. We have reached the third degree where we devote our intelligences to anticipating what average opinion expects the average opinion to be. And there are some, I believe, who practice the fourth, fifth and higher degrees.”
In other words, gold is supposed to go up, because other people are supposed to believe it will go up and hence will bid it up. Or even, gold will go up because others believe that still others will bid it up. Etc.
In our view, prices are generally set in the long run by a process of arbitrage. For example, if a company can borrow at 1% to buy its own shares which pay a dividend yield of 4%, then it will tend to do so. Especially if management compensation is tied to the share price. Borrowing at 1 to buy 4 is a simple arbitrage.
The gold mining companies are attempting to perform arbitrage, to spend less than an ounce of gold to mine and bring to market one ounce.
There are no arbitrages that tie the gold price to quantity of money or Brexit fears. These are speculations (sometimes well founded, sometimes not). Those not armed with the data showing the fundamentals of supply and demand are guessing what newspaper contest entrants will predict other entrants will vote for the most attractive gold price.
Of course, at the end of the day, people will flee the failing paper currencies like johns fleeing a burning whorehouse. But a lot can happen between now and when the red light district catches fire.
So let’s look at the only the only true picture of the supply and demand fundamentals for gold and silver. But first, here’s the graph of the metals’ prices.
The Prices of Gold and Silver
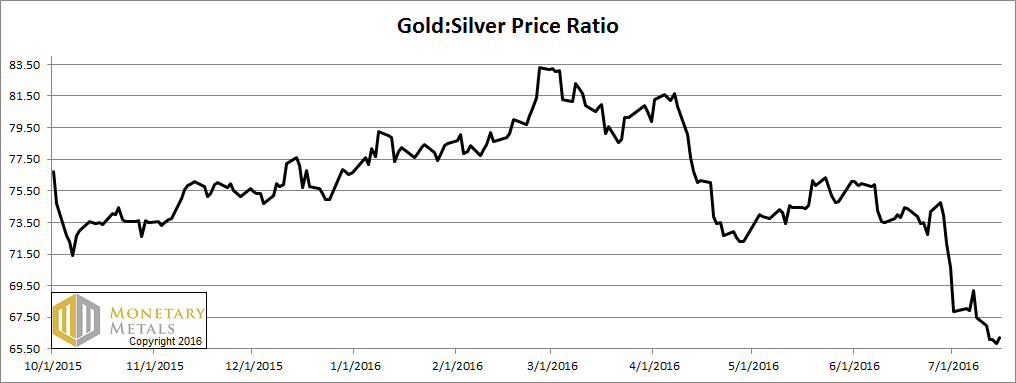
Next, this is a graph of the gold price measured in silver, otherwise known as the gold to silver ratio. The ratio declined a bit more this week.
The Ratio of the Gold Price to the Silver Price
For each metal, we will look at a graph of the basis and cobasis overlaid with the price of the dollar in terms of the respective metal. It will make it easier to provide brief commentary. The dollar will be represented in green, the basis in blue and cobasis in red.
Here is the gold graph.
The Gold Basis and Cobasis and the Dollar Price
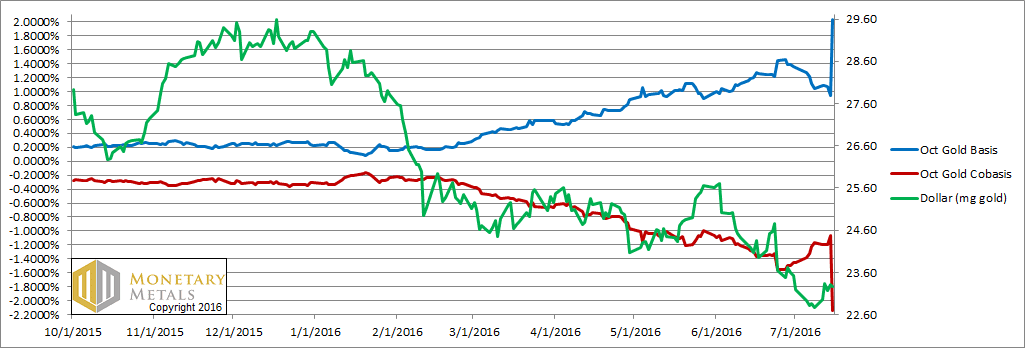
We have to say that we are skeptical of the large move up in the basis (i.e. abundance) and downward in the cobasis (i.e. scarcity). We want to see the data for this coming week.
If this is a real move in the bases, then demand in gold just dropped and/or supply just increased.
Now let’s turn to silver.
The Silver Basis and Cobasis and the Dollar Price
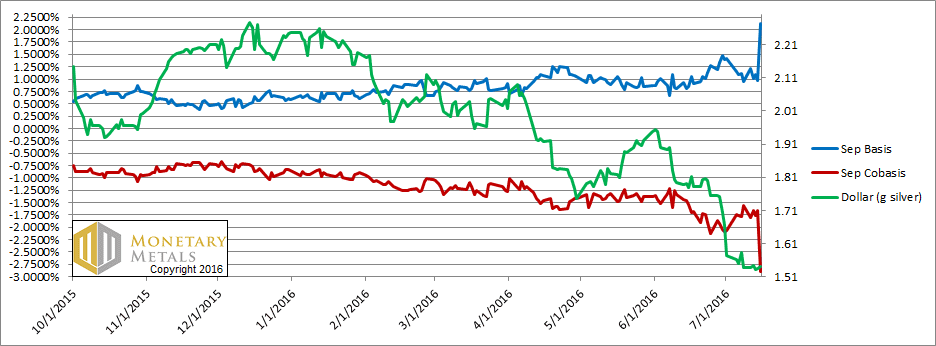
The same thing happened in silver.
These are big moves. In the case of silver, the basis is up +1.1%.
Using a secondary data source, the move did not occur. So take it with a grain of salt until we get confirmation or non-confirmation.
Bron was speaking to a US contact last week and they said that coin demand was poor and dealers were building up inventory. This could possibly indicate wider physical demand softness.
© 2016 Monetary Metals

any video of the panel discussions at freedom fest?
I think we will find that ‘using a secondary data source, the move did not occur’…. with the fundamental situation quite similar to last week even at these slightly lower prices. The specs will need to flex their muscles here as they are rowing against the current and what could be a turnaround in the GSR.
I can echo Bron’s observation; inventories are building. Buy back bids are also falling, and hard.
I repeat last week’s comment. This is a terrible time to be stacking. If anything, I would use strength to continue raising cash.
Just for the record: If your stack is not large and/or you stack monthly, “now” is a great time. The dollar is still much stronger than…what it’s going to be eventually.
Another interesting data point http://www.silverdoctors.com/silver/silver-news/us-mint-announces-end-of-silver-eagle-allocation/ silver Eagles coming off allocation.
Why monitor the October contract in gold for this analysis? Looks like it has very thin volume and infrequent trading. December has much more open interest if there is concern the August contract is distorted from pending expiry.
August Gold 2016
Current Volume: 158,106
Open Interest: 317,354
October Gold 2016
Current Volume: 3,035
Open Interest: 41,581
December Gold 2016
Current Volume: 26,855
Open Interest: 190,171
John Maynard Keynes theory as presented in this article does not ring any bells with me or I suspect with most people.
I have yet to me anyone who when given a choice between things spends time wondering what the average, average person would choose.
So John Maynard Keynes nil. Common sense one.
It may not be how the average person approaches it, but Ben Hunt http://www.salientpartners.com/epsilon-theory/ has a lot of professionals following his work which builds on the beauty contest/common knowledge theory, see http://www.salientpartners.com/epsilon-theory/a-game-of-sentiment/
The limit as the “degree” of guessing goes to infinity is also called the Nash equilibrium. It is a game theoretic approach to pick a strategy most likely to beat an opponent who is similarly working to anticipate your moves.
Further to my John Maynard Keynes point.
You must ask yourself a simple question:- 1. Are all markets rigged… or 2. Are they governed purely by genuine supply and demand.
If the answer is 2. then you are correct.
If the answer is 1. then you are correct when you guess correctly.
To the extent we can trust esignal quote data and my math is correct, here are some Tuesday night numbers.
===== Gold ======
August 2016 Futures (First notice day July 29)
Spot Gold Bid: 1331.98
Spot Gold Ask: 1332.35
Jul 19 2016 22:57:53 EDT
Gold Aug’16 Bid: 1332.40
Gold Aug’16 Ask: 1332.50
Jul 19 2016 22:57:52 EDT
Carry: $0.05
Basis: 0.02%
De-carry: -$0.52
Cobasis: -0.234%
____________________
December 2016 Futures (4 months carry trade)
Jul 19 2016 22:41:04 EDT
Spot Gold Bid: 1332.36
Spot Gold Ask: 1332.66
Jul 19 2016 22:40:51 EDT
Gold Dec’16 Bid: 1340.20
Gold Dec’16 Ask: 1340.40
Carry: $7.54
Basis: 1.69%
De-carry: $-8.04
Cobasis: -1.81%
Oct’16 Gold Future trades:
Time of last trade: Jul 19 2016 22:17:55 EDT
Time of last trade: Jul 19 2016 23:02:40 EDT
The October gold future contract saw consecutive trades executed 45 minutes apart on very low volume. New Zealand westward to China, about 1/3 of the world’s population were on open market hours. How can trading in this contract be a barometer of anything at this point?
===== Silver ======
Spot Silver Bid: 19.898
Spot Silver Ask: 19.930
Jul 19 2016 23:18:46 EDT
Silver Sep’16 Bid: 19.97
Silver Sep’16 Ask: 19.975
Jul 19 2016 23:18:59 EDT
Carry: $0.04
Basis: 1.20%
De-carry: -$0.077
Cobasis: -2.32%