
Supply and Demand Report July 14, 2013
“Gold went up every day this week,” is how most people would say it. This would be cause for great cheer. Of course, we say it differently “the dollar fell every day this week.” Expressing it this way makes it clear that there is no cause for celebration. As we see from looking at the gold basis, owners of gold are in the process of withdrawing their bid on the dollar.
As we go forward, there is more and more boilerplate material in this report. This is good for first-time readers or as a refresher. But if you are reading it every week, you may want to skip over it. To make the report more readable by both groups, all repeated boilerplate material that is repeated from the prior week is be marked in italics like this.
The Gold Basis Report is fundamental analysis of gold and silver. The basis is a measure of availability of metal to the market. When the basis is high and rising, then metal is abundant. When the basis falls below zero, and the cobasis rises above zero (gold goes into backwardation) then that means danger (and likely higher dollar prices).
The basis doesn’t measure flows of metal from one corner of the market to the other. We make no assumptions that one side is the “dumb” money and one side is the “smart” money. The basis measures the spread between the spot price and the futures contract price.
Obviously, the recent falling price tells us that demand for gold and silver is lower. But the basis is also falling, and this tells us that those who do buy gold want it now. They are willing to pay a premium to get it now, and don’t want to wait until August for gold or September for silver.
Since gold and silver have huge inventories that are not consumed—they are held for monetary purposes—a sign of scarcity of the monetary metals in the market is a sign that the dollar is moving towards collapse, when gold will no longer bid on it.
One cannot truly understand the gold market in terms of the quantity of dollars, price charts, or by charts of open interest, ETF holdings, COMEX inventories, etc. One must study the basis.
In general, the positive basis (i.e. contango) is disappearing (hence the full name of this report). This is a process of gold withdrawing its bid on the dollar. One cannot understand this if one lives in the dollar bubble, looking at the gold “price” as if it were comparable to the price of Apple shares or crude oil.
The “bull market” in gold and silver is not over. We do not recommend that anyone sell his gold now, unless he is using leverage (and we don’t recommend using leverage). When the gold price rises, we don’t recommend selling then, either. A rising gold price gives only an illusion of profit (and the tax man will take a big piece of that).
We generally prefer to look at the price of the dollar in terms of gold, rather than the price of gold in terms of the dollar. The reason is simple. One can measure a rubber band using a steel tape, but not a steel tape using rubber bands.
The price action this week was returned to “normal”. The dollar fell a bit. It is now under 24.5mg. This is still high by recent years, but off the high set a few weeks ago of about 26mg.
The Price of the Dollar
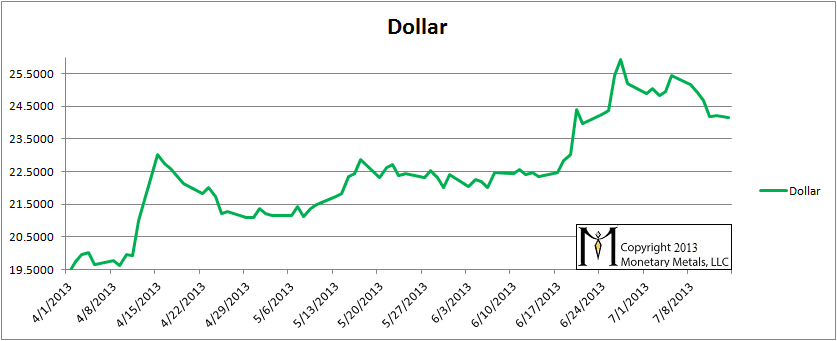
We believe that the dollar has been getting stronger for the simple reason that debtors are being squeezed. They are scrambling to get dollars. It is not just Japan with a collapsing bond market but possibly China as well. If this gets going in any significant way, the price of every asset from copper to real estate in LA could crash.
In this report, we have been tracking the temporary backwardation in both metals. It is like a distortion field; as we move closer to each futures contract expiry, that contract is pulled into backwardation. The bid drops, which causes the basis to fall off the bottom of the chart. This could be due to heavy selling, as naked longs must sell before First Notice Day (since they haven’t got the cash to buy the metal). Their selling, of course, presses down the bid.
But the mechanics of the contract roll does not fully explain the phenomenon. For one thing, the distortion field is wider for silver than for gold. The basis for September silver has been falling in earnest since shortly after the April 15 crash. This shows that scarcity is increasing at the lower price.
Think of temporary backwardation as rot in the heart of a tree. It can spread for years, undermining its integrity. The collapse of the tree at the end is “unexpected”. As the financial system rots, people increasingly discount monetary metals for future delivery. Despite the cost to carry gold, it is cheaper to buy gold for delivery in August than it is now.
You could lock in the price now, and not have to come up with the money for two months. And you are offered a discount to do this. Few people appreciate the significance, just as only a tree surgeon would recognize the rot in the heart of a tree.
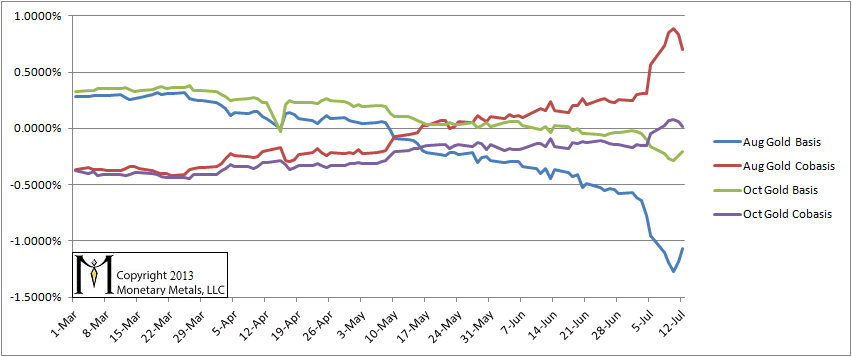
For gold, we now show both August and October, as August is in the middle of the contract “roll”. This is when the “naked longs” must sell, and if they wish to remain long gold they can buy October or some other month. This puts pressure on the bid for the August contract, which we see as a falling basis. It also puts pressure on the offer for October and December, which we should see as a falling cobasis.
The August basis moved down and up, and cobasis is flat to rising. Gold is at its scarcest in a long time. Especially look at the move on Friday! The October cobasis is almost up to zero, backwardation. The week before this week, we saw this pattern. But this week, the basis and the cobasis for both months moved in the same direction. The move, therefore, was driven by market fundamentals and not the contract roll mechanics. The week was just about a wash. The October cobasis entered backwardation on Monday and remained there in Friday, just barely.
Gold Basis and Cobasis
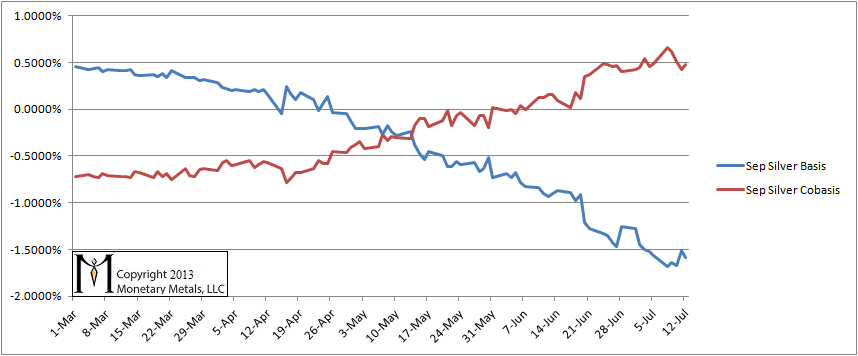
Here is the basis chart for September silver. Silver still does not want to get scarcer.
Silver Basis and Cobasis
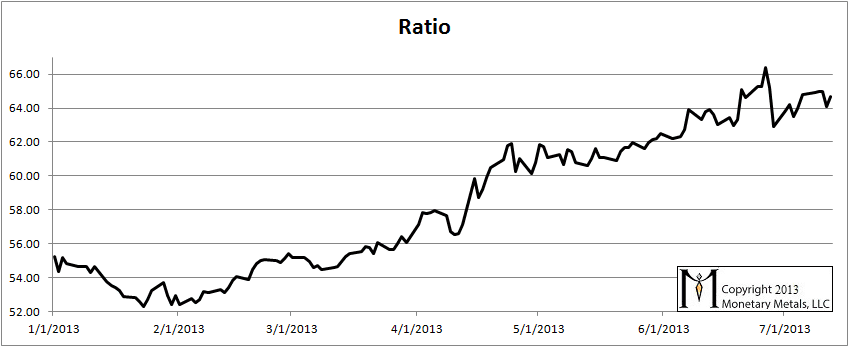
Here is the graph showing the ratio of gold to silver. It did not change much from last week.
Our prediction (in a video and articles) was for the ratio to reach at least 60 and maybe 70. At the time, the ratio was 52.
Last week we wrote, “At the moment, we would not bet either on a rise or a fall of the ratio.” If we had to pick a direction, we would guess upwards. But we would not necessarily bet on it.
Gold to Silver Ratio

Thank you for your analysis and for making it available to the public.
Looking at the gold basis and cobasis chart, it appears that what we see in the last two weeks is very significant. It looks to me like the first significant, sustained dip into backwardation since you began reporting this data on the gold basis. Am I missing something?
Keith,
These charts are unique entries into the public discussion; thanks for posting them and please continue to keep us apprised of this news. Having read Fekete for almost 10 years, I still appreciate your “boiler-plate”. Theory alone did not convert NASE critics, but your down-to-earth treatment of the facts, and analysis of the news may open a new front in the battle to take the con out of economics.
Thanks for your comments Dave and Gregory.
Dave: This is the same pattern we’ve been in for many a month now. The “reality distortion field” keeps moving forward, encompassing the next future and the next, each a little sooner than the last time.
A dramatic (perhaps also imaginative?) retelling of this “gold withdrawing its bid for the dollar” story comes from Grant Williams via John Mauldin at http://www.mauldineconomics.com/ttmygh/what-if
Their answer to how gold’s price can fall even in backwardation is still “manipulation”. This is a seductive argument in a world so brutalized by fraud and lies from the banking quarter; I find it hard to shake off. But appearances have deceived me before, so I’m still engaged by your NASE Reality-based analysis.
The one fact Grant mentions is that bullion bank defaults are being papered over “in cash”. This complicates the story. Not all the cash recipients are going to put those proceeds on the bid for spot gold.
Not every bullion bank is going to be bailed out. The cash needed to unwind the gold carry trade will constitute a serious demand for dollars from bullion banks, which seem to be in a position to bid with gold (even though doing so now exposes them as being on the wrong side of default).
Interesting times!
Your chart shows silver’s basis is declining and negative. Your heading comment for the chart is silver does not want to get scarcer. Your boiler plate says rising and positive basis means more abundance. So why isn’t a declining basis scarcity? Plus the Oct basis for gold is down and negative and you do say it is scarce. Again, “scarcity” in a severe market bear markets like we’ve been experiencing logically just says people don’t want to sell. But as you know, producers and retailers eventually have to sell.