
Monetary Metals Supply and Demand Report: June 16, 2013
The Last Contango Basis Report
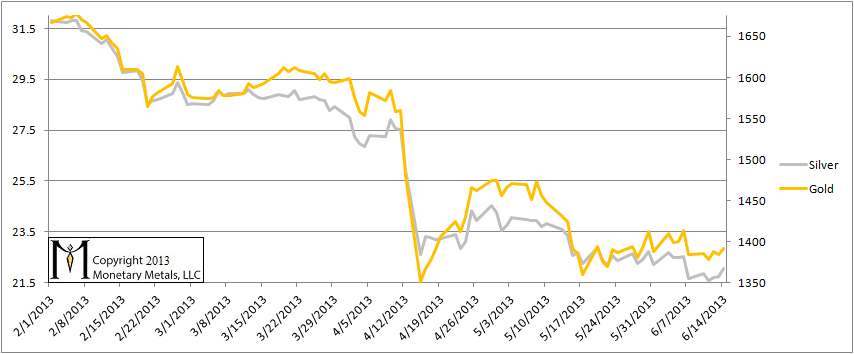
The prices of the metals rose a bit during the week, especially on Friday. But as we can see in this chart, gold is still bouncing around the low made on April 15 and silver is still below.
One cannot truly understand the gold market in terms of the quantity of dollars, price charts, or by charts of open interest, ETF holdings, COMEX inventories, etc.
One must study the gold basis (see here for a basic explanation). Think of the basis as a scarcity indicator. Since gold and silver have huge inventories that are not consumed—they are held for monetary purposes—a sign of scarcity in the market is a sign that the dollar is moving towards collapse, when gold will no longer bid on it.
The positive basis, i.e. contango is disappearing (hence the name of this report). This is a process of gold withdrawing its bid on the dollar. One cannot understand this if one lives in the dollar bubble, looking at the gold “price” as if it were comparable to the price of Apple shares or crude oil.
The “bull market” in gold and silver is not over. We do not recommend that anyone sell his gold now, unless he is using leverage (and we don’t recommend using leverage). When the gold price rises, we don’t recommend selling then, either. A rising gold price gives only an illusion of profit (and the tax man will take a big piece of that).
In this report, we have been tracking the temporary backwardation in both metals. It is like a distortion field, as we move closer to each futures contract expiry, that contract is pulled into backwardation. The distortion field is wider for silver than gold. The bid drops, which causes the basis to fall off the bottom of the chart. This could be due to heavy selling, as naked longs must sell before First Notice Day (since they haven’t got the cash to buy the metal). This selling must be on the bid, which would press it.
But this does not fully explain the phenomenon. The basis for September silver has been falling in earnest since shortly after the April 15 crash. This is commensurate with a theory of rising scarcity at the lower price, rather than merely reflecting the mechanics of the contract roll.
It is not just that the basis is falling. The cobasis tends to rise at the same time. In the past two Reports, we have been discussing the September silver cobasis. It is now currently backwardated, but just by a smidge (under 0.1%). It fell with the rising price on Friday, which suggests that it was speculators in the futures markets, rather than buyers of physical metal, that drove the price up sharply (possibly in response to comments on Thursday by Jon Hilsenrath regarding QE).
Think of this as rot in the heart of a tree. It can spread for years, undermining its integrity. The collapse of the tree at the end is “unexpected”. The financial system is rotting. People are increasingly discounting monetary metals for future delivery. When they want it, they want it now. At the moment, not that many of them want it, which is why the price of the metal is at a low point. Think spread, not price. Think about what this inverted spread is saying. Despite the cost to carry gold, it is cheaper to buy gold for delivery in August than it is now.
You could lock in the price now, and not have to come up with the money for a few months. But you would not have to pay interest on this deal. Instead, you will be given a discount. Few people appreciate the significance of this. Just as only a tree surgeon would recognize the rot in the heart of a tree.
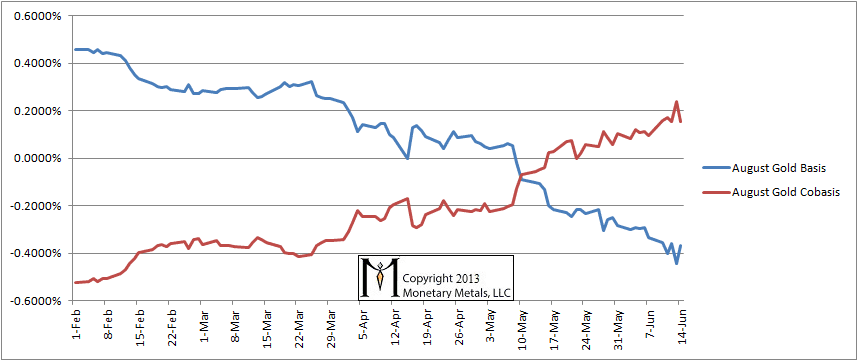
The August basis continues to fall, and cobasis was rising until Friday.
Gold Basis and Cobasis
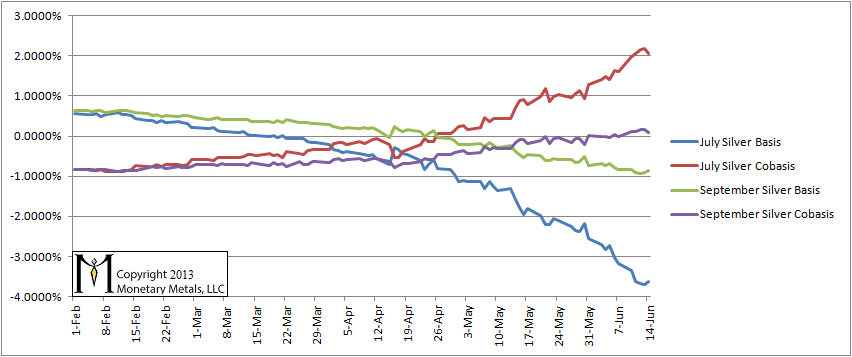
Here is the basis chart for July and September silver. The contract roll is underway so we will show September as well and soon drop July. The July contract is under heavy selling pressure due to the mechanics of the roll, and it is therefore interesting that on Friday, the basis rose and cobasis fell. Not a bullish development (though we would not recommend a naked short on silver now, or ever), and it mirrors what we saw in gold—the price blipped and the basis rose / cobasis fell.
Silver Basis and Cobasis
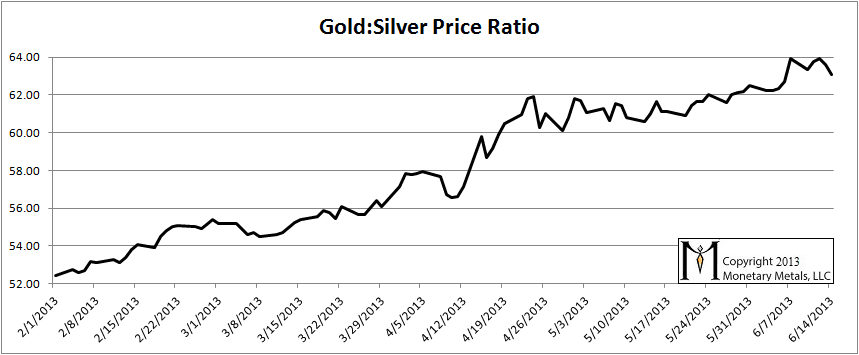
Finally, here is the graph showing the ratio of gold to silver. It backed off a bit from the high last week. In January, we explained why the ratio would rise. Our prediction (in a video and articles) was for the ratio to reach at least 60 and maybe 70. At the time, the ratio was 52. We are not reversing our call yet. Should something precipitous occur in Japan, this ratio could spike to an astonishing height.
If the velocity of the M2 money supply is decreasing, does that make a case for price deflation?
http://research.stlouisfed.org/fred2/graph/?id=M2V
If so, does this make a case for dollar hoarding since M2 money supply is still increasing at the same time? Shouldn’t the money supply even if it remains positive, at least show a decline in the rate of increase?
http://research.stlouisfed.org/fred2/graph/?id=M2
Doesn’t it make sense that if there was deflation (a monetary system based off of debt) that deleveraging would decrease both the velocity and the increase in the money supply?
Thank you for this excellent commentary