
Mea Culpa, Report 9 April, 2017
Dear Readers,
I owe you an apology. I made a mistake. I am writing this letter in the first person, because I made the mistake.
Let me explain what happened. I wrote software to calculate the gold basis and cobasis (and of course silver too). The app does not just calculate the near contract. It calculates the basis for many contracts out in the distance, so I can see the whole picture. I developed a model for the fundamental price, based on the basis. My software calculates this, too (spoiler alert: the reported fundamental prices were high).
I have long since debugged it. It works reliably. So reliably, that every day I pored over the results, but I no longer checked the inputs and intermediate steps of the calculation. Now, in retrospect, I realize that I should have.
The root cause is simple. For as far back as I have ever seen, the symbol for a future has been a two-letter code for the commodity + a one letter for the month and one digit for the year. For example, gold is GC. December is Z. And 2017 is 7. So the December gold contract is “GC Z7”. Silver is SI, so December silver is “SI Z7”.
I did not expect my realtime quote provider to change year codes for contracts in 2018 and beyond. No longer is it one digit for year—8 in this case. Now it requires two digits. So the December 2018 gold contract is “GC Z18”. Even now that I have looked, I do not find any announcement of this change. I am not even sure it is an official COMEX change, or just a quirk of one quote provider.
This error was compounded because my software was not programmed to notify me of a problem. In software, the only thing worse than a failure in a system that is used in production is a silent failure that goes unnoticed, and hence goes uncorrected. This failure was unnoticed.
Before I get to the impact, I want to discuss how we will make sure this does not happen again.
My team and I have been working hard on a new website, and the centerpiece will be our ongoing data science work in the precious metals markets. We will publish about 45 graphs, with daily updates. Obviously, this is driven by a much more sophisticated software system than my humble application.
The new software is developed by one of the best coders in the world (not me, I’m rusty after not coding full-time in almost 15 years). Rudy Mathieu worked for my last company, a software company called DiamondWare.
Rudy has built a hardened, enterprise-grade software system (now undergoing extensive testing), and when it encounters an error, it does not fail silently. It is constantly checking the status of all key components, and has a dashboard so we can monitor how the software and the server running it are doing. It emails us if anything goes wrong. It will instantly detect problems, such as a change in the year code or even the Spanish Inquisition, which nobody expects (sorry, just a bit of humor).
For years, I have been publishing a unique view into the markets. Our new site takes it a thousand times further. I expect that it will become an essential tool for anyone who uses or trades gold. We need to ensure it is as reliable as clockwork.
I promise to make it so.
Back to the question: what was the net effect? My software was not able to calculate a basis for gold or silver contracts maturing in 2018 or beyond. However, my fundamental price model relies on them. Its accuracy began to suffer starting around last August. This error continued to grow in magnitude. As of last week’s Report, the fundamental price of gold was overstated by about $175, and silver’s fundamental by $2.30.
The correct fundamental prices as of Friday March 31 were about $1,260 and $16.70.
Interestingly—and this is important—the gold-silver ratio fundamental was robust to this error. The value stated in last week’s report, 75.75, was almost perfect. It was off from the revised estimated fundamentals by 0.2. I say revised and estimated, because I went back over the time period where I have incomplete data and derived what I need. The result is good enough for horeshoes and hand grenades, as we say in America (but it has higher uncertainty).
There is a bigger lesson here. Monetary Metals focuses on the ratio (which we trade in our fund), because it is less error-prone, more accurate, and less risky than trading either metal against the dollar.
OK… The bottom line is that on March 31, the corrected gold fundamental was above the market price, though not nearly so far above as I had reported it. It was about 1.4% over the market price (I reported 15.6% last week).
As an aside, my friend Pater Tenebrarum at Acting Man blog wrote about the disparity between the fundamental drivers that he monitors, and the fundamentals I reported. He is right in thinking that demand for physical is not going ballistic yet.
Though as you will see in the graphs below, the fundamental price has indeed been rising since mid to late December (as I have been correctly reporting), from a low of around $1,115 to $1261 at the end of March.
The correct silver fundamental price is below the market price. My commentary actually stands up pretty well, in light of the correct data. Even while I erroneously reported a silver fundamental running up to about $19, I have not been enthusiastic about silver. I haven’t “trusted” it enough to encourage a big silver trade, nor called for a major price move. I think there were two reasons.
One, obviously, the nearer-term contracts which I monitor are accurate. They did not show the kind of moves I would expect to see if the market for physical metal was getting so tight. The error only occurred for contracts in 2018. Two, the fundamental gold-silver ratio was correctly calling for a higher market ratio.
Below, I include graphs of the fundamental prices for both metals. The correct values will be overlaid with the ones I have been calculating. So you can see where it went off the rails, and by how far it deviated.
There is one last thing, which I am reluctant to discuss now, before we are ready to launch. Yet it is germane.
Monetary Metals has licensed market data from Thomson Reuters. When the new charts go live, they will be based solely on this data. This data is of better quality than the data from the realtime quote provider I have been using. And we have developed some very sophisticated algorithms that allows us to extract the maximum signal with the least noise, far superior to what my little app does with the data from my current provider.
The new basis and fundamental prices will not line up perfectly with the old data series. One reason is that the bid-ask spread is tighter. By the nature of the math to calculate the basis, tighter spread means a higher basis and higher cobasis.
That said, I am confident of two things. One, the new data is more accurate. And two, the old data set has served well in showing the big picture (notwithstanding the error I corrected this week).
We will look at the only true picture of supply and demand in the gold and silver markets. But first, the price and ratio charts.
The Prices of Gold and Silver
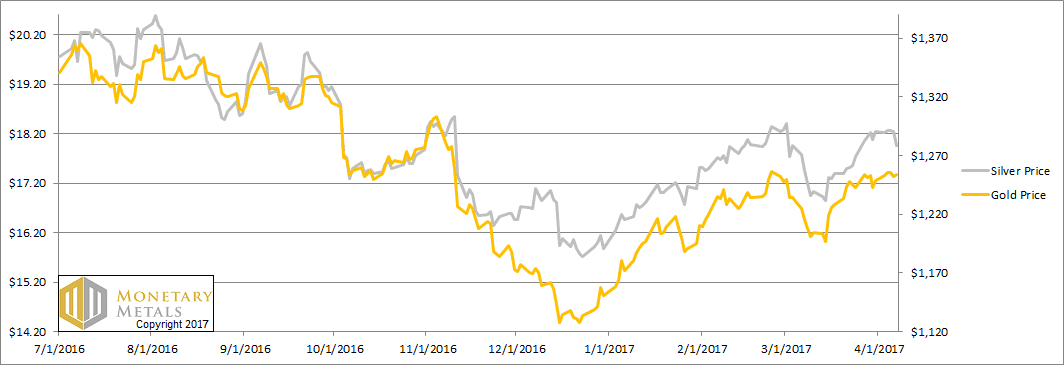
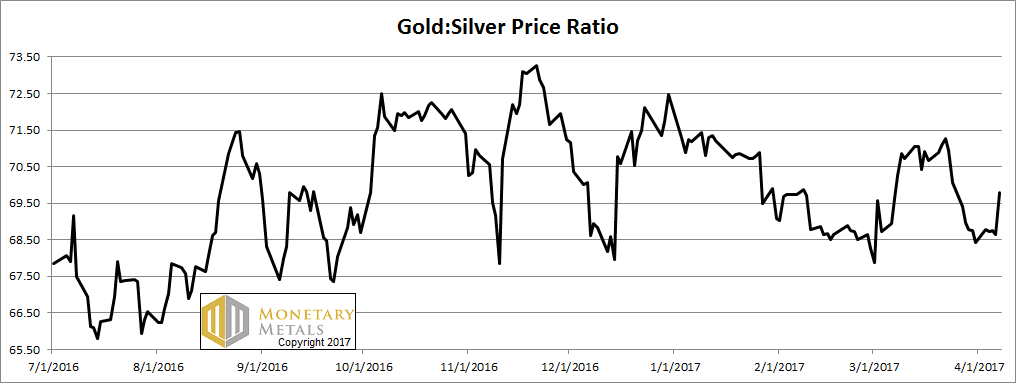
Next, this is a graph of the gold price measured in silver, otherwise known as the gold to silver ratio. Last week, we asked if the downward-moving gold-silver ratio had hit a line of support. It seems it did, as it moved up sharply on Friday.
The Ratio of the Gold Price to the Silver Price
For each metal, we will look at a graph of the basis and cobasis overlaid with the price of the dollar in terms of the respective metal. It will make it easier to provide brief commentary. The dollar will be represented in green, the basis in blue and cobasis in red.
Here is the gold graph.
The Gold Basis and Cobasis and the Dollar Price
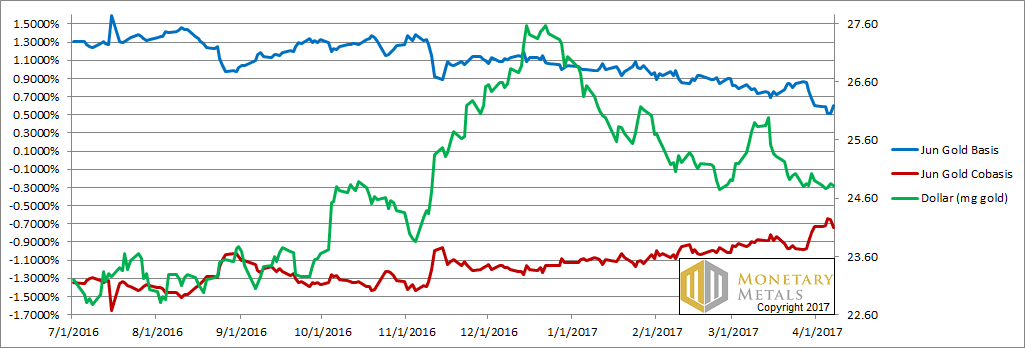
Not much change in the scarcity of gold (i.e. the red line, the cobasis) while the price moved up slightly. Our calculated fundamental price is up $30, to about $1,290.
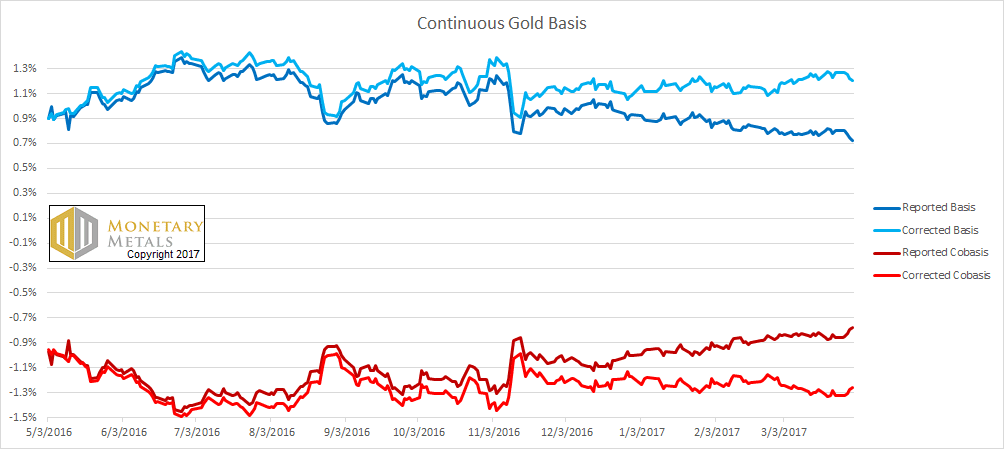
Let’s take a look at two graphs. Both show enough time to see where the error began to creep in, and where it ends. They are May 3, 2016 through March 31, 2017.
The first is the continuous gold basis, with the erroneous line overlaid with the corrected. As you can see, the erroneous basis was lower (indicating, falsely, lower abundance) and the erroneous cobasis was higher (indicated higher scarcity).
The Reported and Corrected Gold Basis and Cobasis
The second is the market price of gold, overlaid with the erroneous and corrected fundamental prices.
The Reported and Corrected Gold Fundamental Prices
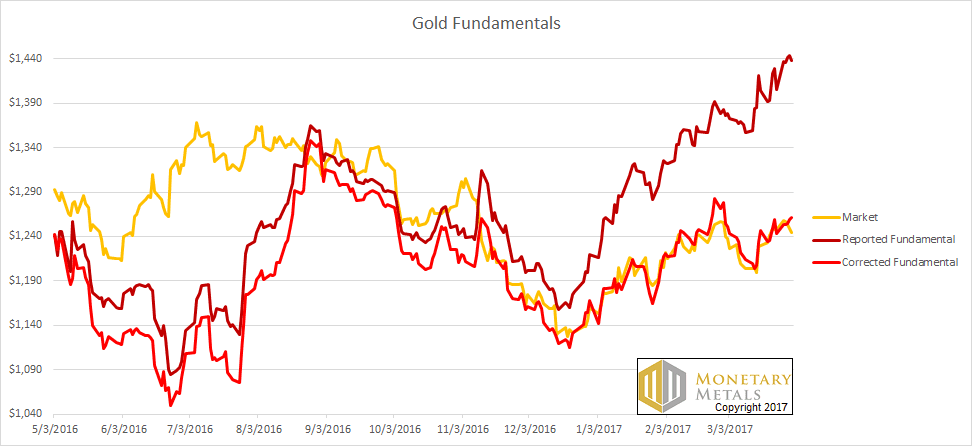
The erroneous one takes off for the stars. The corrected value is much closer to the market price, though a bit above.
Now let’s look at silver.
The Silver Basis and Cobasis and the Dollar Price
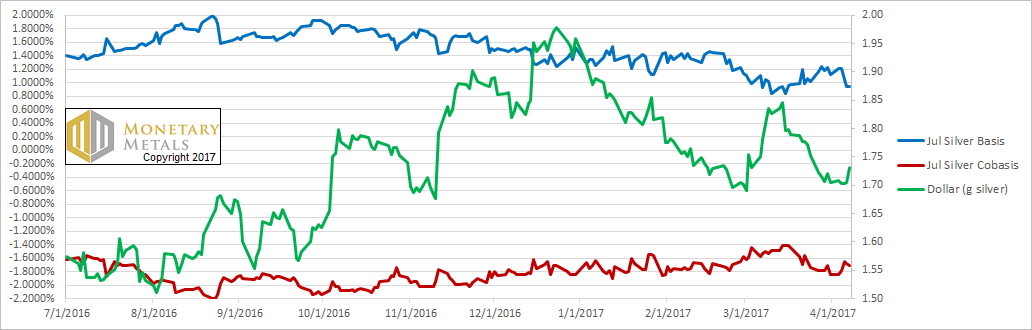
We switched from the May to the July contract, as the May contract is in the process of being rolled (where traders must close positions in May and if they want to keep their positions, open a July or farther-out contract).
There is a small decrease in the basis and increase in cobasis, along with a falling price this week. And our fundamental price is up 14 cents, to just under $16.85. Yes, alas, that is more than a buck under the market.
Here are the same extra two graphs for silver.
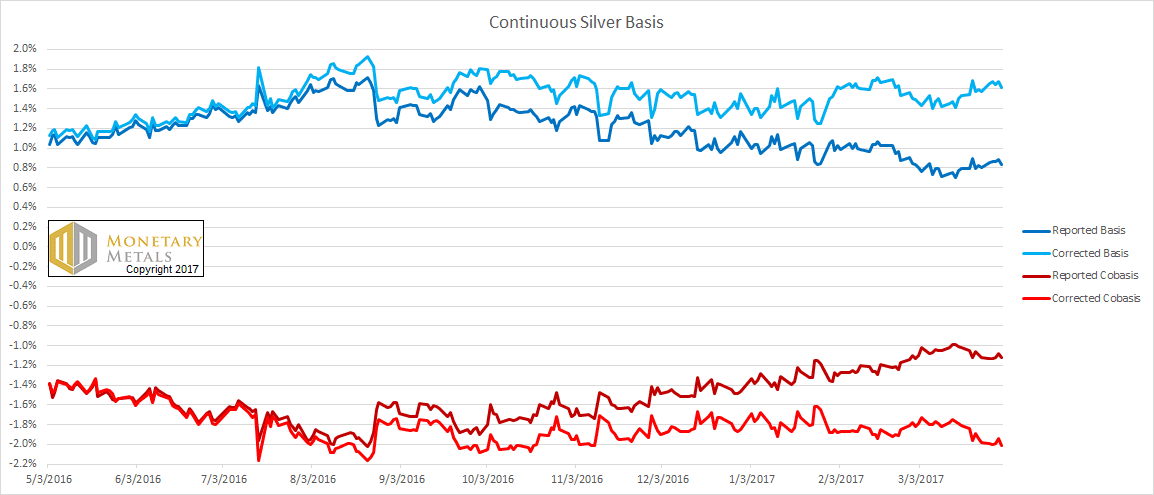
The Reported and Corrected Silver Basis and Cobasis
The Reported and Corrected Silver Fundamental Prices
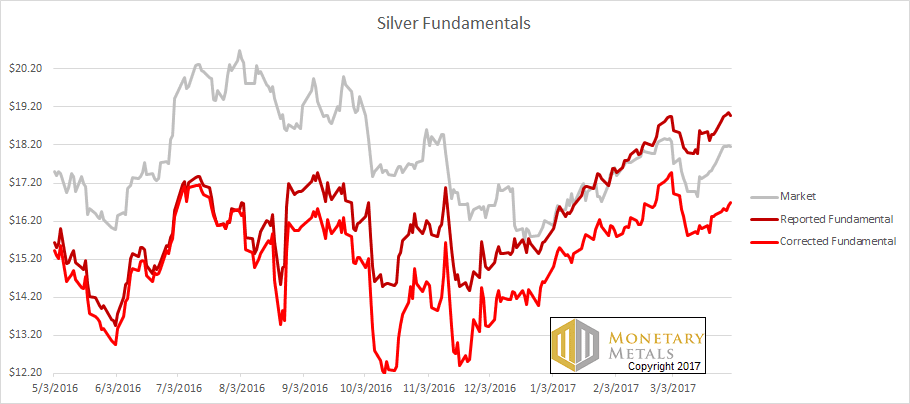
You can see here that there are two salient features. One, the fundamental has been rising for about a month longer than gold, though from a much more volatile bottom ($12.39). Two, the fundamental is way below the market price.
© 2017 Monetary Metals
Well spotted Keith and thank you for your honesty. The new ‘picture’ seems more realistic to me and I’m rather pleased because I don’t have much dry powder at the moment.
Keith,
Different providers use different codes for same data. Right now, the online broker OptionsExpress shows GCM17 while TD Ameritrade shows /GCM7
And retail providers like to change, and their data feeds like to change as well, including sometimes their T&Cs so what you think is the same is not actually the same.
A classic one is the closing price. If you check the closing price of e.g. DJIA over a dozen sources, you will find that on certain days they are not the same! (and I’m not referring to days were trading is halted. Sometimes the formula for “computing” a close value changes, sometimes the value is manually fudged, sometimes the last trade is not on the main exchange but the main is reported, etc.).
=> I suggest that you keep a backup feed and always do a comparison, as you cannot detect “bad data” just by looking at it – you need a separate reference.
Another idea I suggest, is to trigger a manual check when all conditions seem fine, but your computed abs(true value – market value) exceeds a certain percentage. This would help you detect issues that you have not even discovered and cannot protect against (unknown unknowns). In the present case it would have alerted you earlier that something was drifting.
Good luck!
wrt: the fundamental gold: silver ratio chart. The charts with corrected fundamental prices vs market prices show significantly different patterns. Silver shows a persistent gap between fundamental vs market price, and gold (since 09/16) shows an extremely close tracking to market price. I would expect that to reflect in the gold:silver ratio, and show a gap between a ratio based on your fundamental prices vs market prices. But when I look at the goldprice.org site and their ratio charts, their gold;silver ratio (based on spot prices) is a very close match to your fundamental gold:silver ratio. Please clarify whether your fundamental ratio chart is based on market price (per your definition) or fundamental price. Also: any comments of why silver fundamental to market price shows the persistent gap, and the 5/16 to 9/16 divergence in gold fundamental to market price.
Mlyons, I did not post a chart of the fundamental on the gold-silver ratio this time. The chart at the top (with the black line) is the *market* gold-silver ratio per our standard Supply and Demand Report format.
Whoa. You never put in any code like, “if (contract symbol violates my expected format) { throw Exception }” OMG!
My one comfort in this is, a few weeks ago, I did post a comment saying that your fundamental prices seemed way too far above market – given that the bases were still substantially positive, we had the speculators being net long or close to it, etc.
Yes, we should expect to see some more serious backwardation when the fundamentals are really that tight.
The classical “COT report” (example: http://snalaska.com/cot/current/charts/SI.png) shows speculators being distinctly long in silver. That indicator fits with the positive basis and your fundamental silver price being below-market. Whew! Planets lined up like they’re supposed to be.
Well played, Keith. You earn my respect by publishing your error as soon as you discovered it. It marks you out not only as an honest man, but as a true ‘scientist’ with more concern for accuracy and the model than for his own blushes.
I wonder, now, if the market prices will come down further as a result of your revised calculations! Something we shall never know. Are you aware of approximately how many people are following your output so far?
I am surprised that the most distant (in the future) prices have such a large effect upon your model’s output. Does it give the same weight to futures prices further away as to those closer?
Apropos your “In software, the only thing worse than a failure in a system that is used in production is a silent failure that goes unnoticed . . .”, at the beginning of my career, I spent some years working as a computer programmer Civil Servant for the UK Ministry of Defence on a high value inventory control system. Despite considerable camaraderie among us, many who had been working on the project at my level and the next managerial level up for many years, despaired of the system they were require to work on for a number of reasons, some believing that it was fundamentally beyond hope of success. I well remember my boss (a major) one day discovering, after some prolonged investigation, that one particular data item that we recalculated every month from its previous value and new inputs, was, in fact, incorrect by a wide margin and therefore had been almost since the inception of the project. These were the 1970s, when data storage was considerably more expensive and, hence, far more precious, than today’s almost unlimited capacity. His investigation had been concerned with the usefulness of the data item – which he had suspected and later confirmed was nugatory, On the day of his discovery he said, “There is only one thing worse than useless information – *wrong* useless information!”.
(For avoidance of any doubt I am NOT indicating that I believe your output is useless!)
Thank you. “True scientist” is a high honor.
It would be an interesting experiment to determine how much effect, if any, I have on the prices of the metals. While most of the analysts and writers in the space subscribe, they don’t necessarily agree with me. I seriously doubt that the gold price moves on my word.
I will have to leave off discussing the fundamental model at this time. ;)
Yes Keith thanks for your honesty amazing accuracy in Gold this last week, silver a bit of a outlier though.