
Monetary Metals Supply and Demand Report: 3 Nov, 2013
This week, the prices of gold and silver were down 36 bucks and 66 cents, respectively. Prices had been falling the prior Friday, October 25. But CNBC ran a story claiming that Quantitative Easing will continue. That was enough to arrest the fall for the remainder of that trading day, and of course Europe and Asia were offline by then. It seems the story’s effect was exhausted the same day it hit.
As always, we want to know: what are the fundamentals? The speculators try to front-run the fundamentals, and sometimes end up front-running only themselves (as on Oct. 25). The speculators cannot move the price very far, or hold it there for very long if hoarders of real metal are selling into speculative buying, or vice versa.
We are interested in the changing equilibrium created when some market participants are accumulating hoards and others are dishoarding. Of course, what makes it exciting is that speculators can (temporarily) exaggerate or fight against the trend. The speculators are often acting on rumors, technical analysis, or partial data about flows into or out of one corner of the market. That kind of information can’t tell them whether the globe, on net, hoarding or dishoarding.
One could point out that gold does not, on net, go into or out of anything. Yes, that is true. But it can come out of hoards and into carry trades. That is what we study. The gold basis tells us about this dynamic.
Conventional techniques for analyzing supply and demand are inapplicable to gold and silver, because the monetary metals have such high inventories. In normal commodities, inventories divided by annual production can be measured in months. The world just does not keep much inventory in wheat or oil.
With gold and silver, stocks to flows is measured in decades. Every ounce of those massive stockpiles is potential supply. Everyone on the planet is potential demand. At the right price. Looking at incremental changes in mine output or electronic manufacturing is not helpful to predict the future prices of the metals. For an introduction and guide to our concepts and theory, click here.
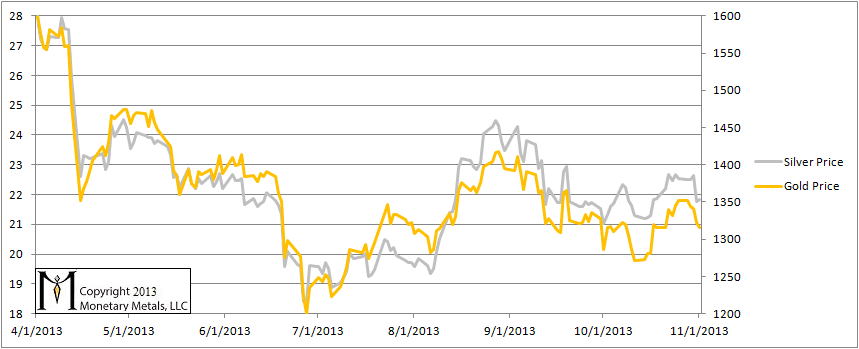
Here is the graph of the metals’ prices.
The Prices of Gold and Silver
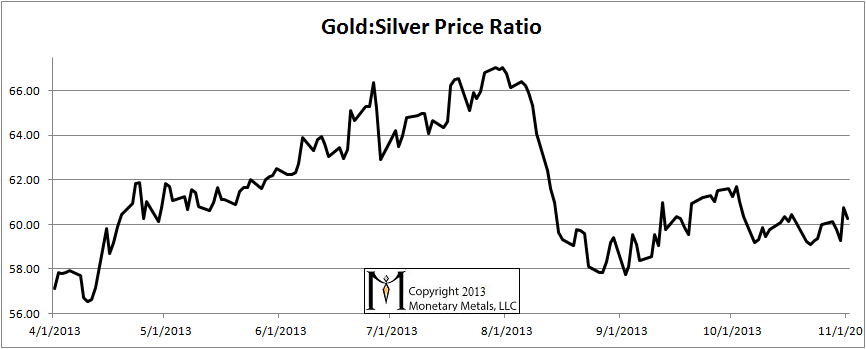
Here is a graph of the ratio of the gold price to the silver price. This shows how many ounces of silver one needs, to buy an ounce of gold. There was as slight rise this week.
The Ratio of the Gold Price to the Silver Price
For each metal, we will look at a graph of the basis and cobasis overlaid with the price of the dollar in terms of the respective metal. It will make it easier to provide terse commentary. The dollar will be represented in green, the basis in blue and cobasis in red.
Here is the gold graph.
The Gold Basis and Cobasis and the Dollar Price
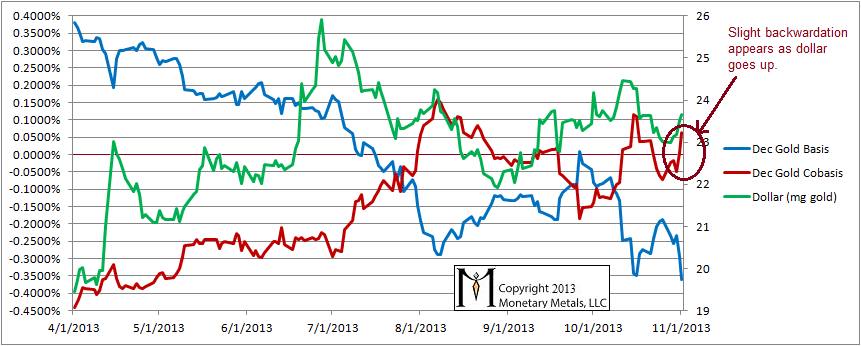
For a few weeks, the price of the dollar had been falling and along with it the cobasis and the scarcity of gold. This week the dollar rose and gold’s scarcity is still tracking with it.
Last week, we channeled Obi Wan Kenobe to say that it was probably not the gold price breakout you were looking for. This week, the gold price is down sufficiently to bear out that prediction. Next week, maybe we shall see a divergence of the cobasis from the dollar price, which will signal a change in the fundamentals.
Now let’s look at silver.
The Silver Basis and Cobasis and the Dollar Price
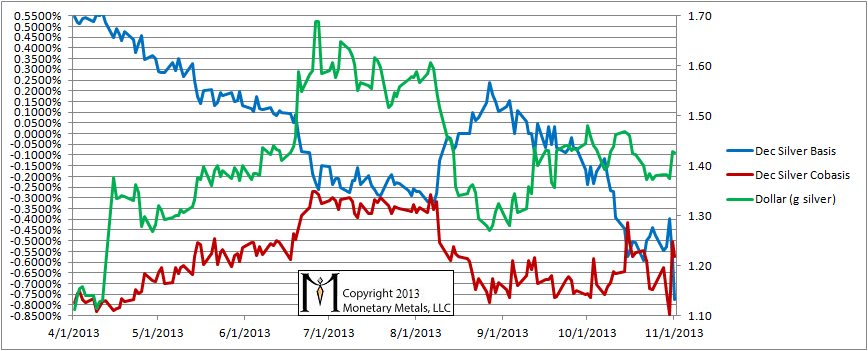
Silver is in a similar trend, though the cobasis is at a much lower level. And it’s curious that the cobasis turned down again on Friday, which did not occur in gold.
A slight backwardation also appeared a couple of weeks earlier when the $ went down. There is no correlation.
Could you please explain exactly what basis and cobasis mean. Many thanks
Please see this page for a full explanation: https://monetary-metals.com/introduction-to-the-monetary-metals-supply-and-demand-report/
I am trying to grasp your methodology and am wondering if the chart can improved by incorporating an additional factor. Kranzler’s research identifies significant paper gold trading with contracts for delivery far beyond the physical available, i.e. naked. In June, he reported the naked trades at over twelve times the physical available; thus, it seems to me that this gold didn’t exist and was virtually created — I am not suggesting price manipulation I have no idea what their intentions were. To get a clearer chart picture, I am suggesting a basis/cobasis-type chart integrate volume, specifically the virtual:physical ratio X total volume. Charts without volume miss the impact of “trading interest” and a commodity that can be maintained as an asset and leased repeatedly and even sold can potentially distort the “truth of the tape” by implying hoarding/dishoarding of a supposedly physical item that in reality may only be an empty promise. Just a thought, interesting stuff you’re doing. Thanks.
mdmiller: Thanks for your question.
There is an officially estimated 170,000 tonnes of gold in the world. For many reasons, I suspect this number is low–off by a factor of at least 2-3. Therefore I do not think one can analyze gold by reference to the quantity of contracts relative to the (supposed) quantity of physical metal. It is simply not true that if one sells a gold future, that one must store the gold in the COMEX warehouse for the entire duration. The gold can and typically is earning something somewhere else.
Two things are important. First, that sellers of futures are hedged. No one (other than nimble speculators and day-traders) should be short gold or silver. Second, that these hedges are carefully matched in duration to the future that was sold. For example, if I have a gold bar and I sell a June 2014 contract against it, I can lease the gold in the meantime–so long as the lease matures before I must deliver in June.
The basis and cobasis show the net state of the market. For example, around summer of 2010, long-dated silver futures went into backwardation. I believe this was due to duration mismatch. The sellers had assumed that so long as they had a hedge, they were OK. But the duration of that hedge mattered. The silver price shot up from around $18 to $49 by the spring of 2011.
Does this make sense?
Some several decades ago I hypothesized that OPEC and the other oil producing entities would be indifferent to holding gold or oil: i.e., there might be a basis for believing there is a relationship between the price of gold and the price of oil.
I went back to 1902, and got weekly prices for gold and oil. Took about two years to get all of the data, up to then 1982. I then put the data into EXCEL, and ran the calculation..
Turns out that, over reasonable periods there is a relatively stable ratio of the price of gold to the price of oil. (As I’m taking the ratio, it doesn’t matter which currency I use, just so long s the currency is the same for both). Now that gold pricks and oil prices are available in data form on the internet, it’s a snap to do the calculation.
the answer is that the ratio seems to hover about 15 or so, plus or minus 2. That is, from 13 to 17.
I’ve had friends who made fairly good fortunes buying and selling either gold or oil, using just this ratio. It’s easy to check, as most daily newspapers and the internet have daily quotes on these two numbers.
If I were to hazard a guess, I’d guess it is the price of oil that is the driver, as it is consumed and is seasonal. So, just by knowing the season, and the expectation of upcoming demand, it’s possible to project a coming price of oil, and hence a coming price of gold.
Give it a try.
Gene, PhD