
Monetary Metals Supply and Demand Report: 10 Nov, 2013
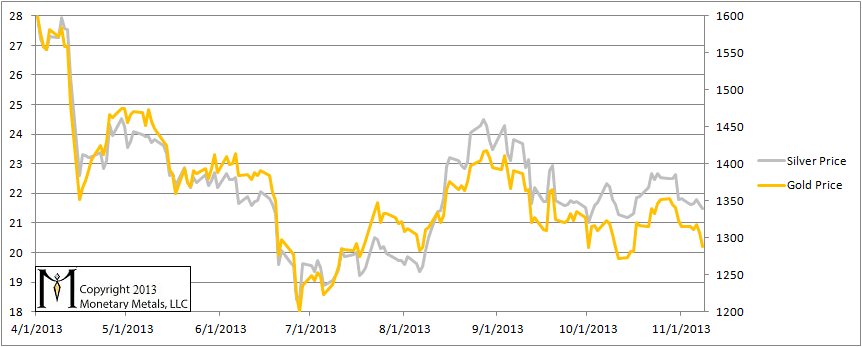
This week, the prices of gold and silver were down 27 bucks and 34 cents, respectively, gold slightly more as a percentage drop than silver. Technical analysts will note that both metals pierced various moving averages to the downside recently.
As always, we want to know: what are the fundamentals? The speculators can run for a while in either direction, but reality will inexorably pull the price back in line sooner or later—to the speculators’ losses.
We are interested in the changing equilibrium created when some market participants are accumulating hoards and others are dishoarding. Of course, what makes it exciting is that speculators can (temporarily) exaggerate or fight against the trend. The speculators are often acting on rumors, technical analysis, or partial data about flows into or out of one corner of the market. That kind of information can’t tell them whether the globe, on net, hoarding or dishoarding.
One could point out that gold does not, on net, go into or out of anything. Yes, that is true. But it can come out of hoards and into carry trades. That is what we study. The gold basis tells us about this dynamic.
Conventional techniques for analyzing supply and demand are inapplicable to gold and silver, because the monetary metals have such high inventories. In normal commodities, inventories divided by annual production can be measured in months. The world just does not keep much inventory in wheat or oil.
With gold and silver, stocks to flows is measured in decades. Every ounce of those massive stockpiles is potential supply. Everyone on the planet is potential demand. At the right price. Looking at incremental changes in mine output or electronic manufacturing is not helpful to predict the future prices of the metals. For an introduction and guide to our concepts and theory, click here.
Here is the graph of the metals’ prices.
The Prices of Gold and Silver
Here is a graph of the ratio of the gold price to the silver price. This shows how many ounces of silver one needs, to buy an ounce of gold. There was as slight fall this week.
The Ratio of the Gold Price to the Silver Price

For each metal, we will look at a graph of the basis and cobasis overlaid with the price of the dollar in terms of the respective metal. It will make it easier to provide terse commentary. The dollar will be represented in green, the basis in blue and cobasis in red.
Here is the gold graph.
The Gold Basis and Cobasis and the Dollar Price
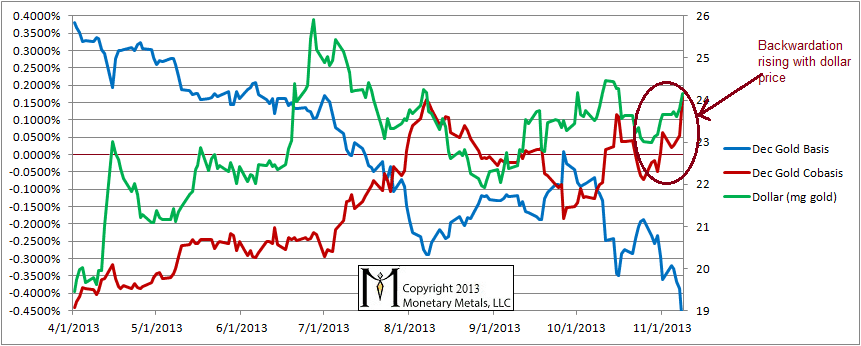
For a few weeks, the price of the dollar had been falling and along with it the cobasis and the scarcity of gold. Now, for a few weeks the dollar rose and gold’s scarcity is still tracking with it. When we see cobasis moving with dollar price (i.e. opposite to gold price, measured in dollars) that is a sign that the speculators are moving the price around. The more they drive the dollar price up (gold price down), the scarcer gold becomes in the market. And vice versa.
Two weeks and $63 ago, we channeled Obi Wan Kenobe to say that it was probably not the gold price breakout you were looking for. Last week, the gold price was down and this week it is down further.
While gold looks a bit scarcer, that is as much a reflection of the phenomenon of temporary backwardation as anything else. Since 2008, there has been a tendency for the expiring contract to dip slightly into backwardation. This should not happen at all, of course, and the fact that it is happening at all is a sign of cracks in the system. That said, it’s nothing new. We’re now well into November, and the mechanics of the contract roll begin to tug on the December basis. Those longs who wish to keep their gold price exposure must soon sell the December contract and buy February or something farther out. A cobasis of 0.16% this close to contract expiry represents a few pennies, and does not represent a bullish signal. The February contract is not backwardated.
Now let’s look at silver.
The Silver Basis and Cobasis and the Dollar Price
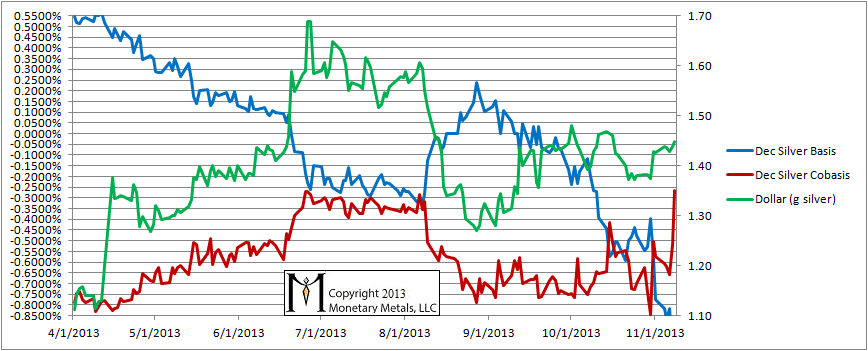
While the silver cobasis has risen sharply, as with gold it is the mechanics of the contract “roll”. It is notable that December silver is not backwardated.f
Keith,
Do you still continue your analysis on when the next contract is backwardated , and the number of days per each contract between the 1st day it entered into backwardation to the end of the contract . Could you share it if so THanks again
Rueffallais: I would if contracts were plunging into backwardation earlier and earlier. The cobasis peaked around early August (and hence backwardation). Since then, the cobasis has come down significantly. We see it rising in the December contract only. It is not especially high, nor notably early, as far as temporary backwardations go.
Keith,
What is your analysis on the matter , in August there was a tension on physical that is receding ?
Your analysis is quite correlated to the GOFO rates in AUgust maximum negativity then receding then negativity, just right now GOFO rates are positive but cobasis positive (probably the rolling of the contract).
It seems anyway that the tension is not there at the moment
What do you think
Hi Keith,
just a thought on the falling prices of gold and silver: Do you think it is related to the falling velocity of money? The fascinating thing about the monetary system is that credit expands but velocity falls while at the same time bankruptcies and capital destruction increase. Do you agree with this analysis?
Since the carry trade and the decarry trade are simultaneous trades (buying and selling at the same time in order to arbitrage) does not each trade have its corresponding effect on the bid price and the ask price? For example, in backwardation, the more actors who decarry the trade the more the bid in the spot would be depressed and the ask in the futures lifted. The same would be true vice versa. What makes temporary backwardation a unique and noteworthy phenomenon is the fact that dollar profits are being dangled in front of actors and for one reason or another (unwilling to relinquish gold hoards) they are not being seized. Is that fair to assume and true to your theory?