
Monetary Metals Supply and Demand Report: 11 Jan, 2015
The price of gold ripped $35, and silver 75 cents. Some are beginning to say that this is the long-awaited breakout. Technical charts are perking up. Hope is growing faster than the prices.
Is this it? Read on, for a picture of the supply and fundamentals…
First, here is the graph of the metals’ prices.
The Prices of Gold and Silver
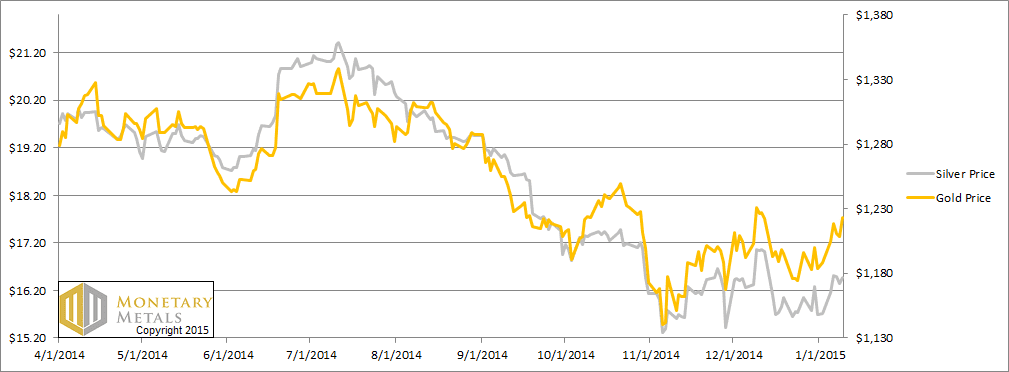
We are interested in the changing equilibrium created when some market participants are accumulating hoards and others are dishoarding. Of course, what makes it exciting is that speculators can (temporarily) exaggerate or fight against the trend. The speculators are often acting on rumors, technical analysis, or partial data about flows into or out of one corner of the market. That kind of information can’t tell them whether the globe, on net, is hoarding or dishoarding.
One could point out that gold does not, on net, go into or out of anything. Yes, that is true. But it can come out of hoards and into carry trades. That is what we study. The gold basis tells us about this dynamic.
Conventional techniques for analyzing supply and demand are inapplicable to gold and silver, because the monetary metals have such high inventories. In normal commodities, inventories divided by annual production can be measured in months. The world just does not keep much inventory in wheat or oil.
With gold and silver, stocks to flows is measured in decades. Every ounce of those massive stockpiles is potential supply. Everyone on the planet is potential demand. At the right price, and under the right conditions. Looking at incremental changes in mine output or electronic manufacturing is not helpful to predict the future prices of the metals. For an introduction and guide to our concepts and theory, click here.
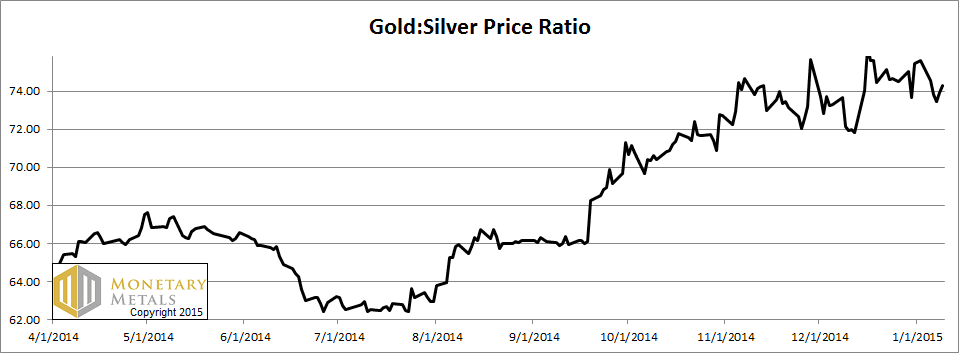
Next, this is a graph of the gold price measured in silver, otherwise known as the gold to silver ratio. It moved down.
The Ratio of the Gold Price to the Silver Price
For each metal, we will look at a graph of the basis and cobasis overlaid with the price of the dollar in terms of the respective metal. It will make it easier to provide terse commentary. The dollar will be represented in green, the basis in blue and cobasis in red.
Here is the gold graph.
The Gold Basis and Cobasis and the Dollar Price
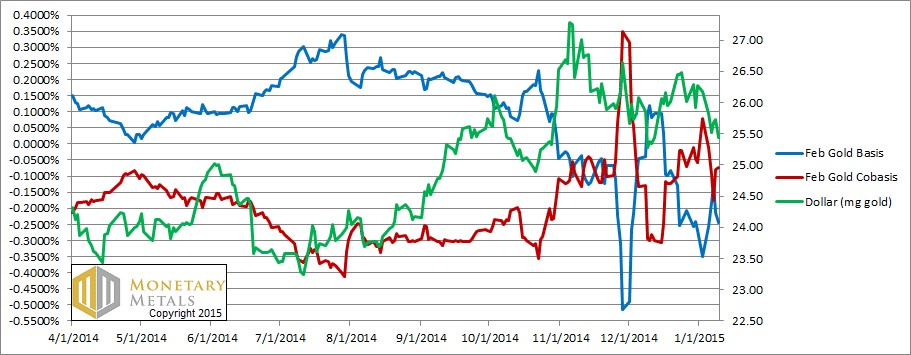
Last week, we noted a small backwardation in the February contract and said, “A sign the fundamentals of gold are firming up. A little bit.”
Well, the price firmed up. A little bit. And with that, the backwardation subsided.
Now let’s look at silver.
The Silver Basis and Cobasis and the Dollar Price
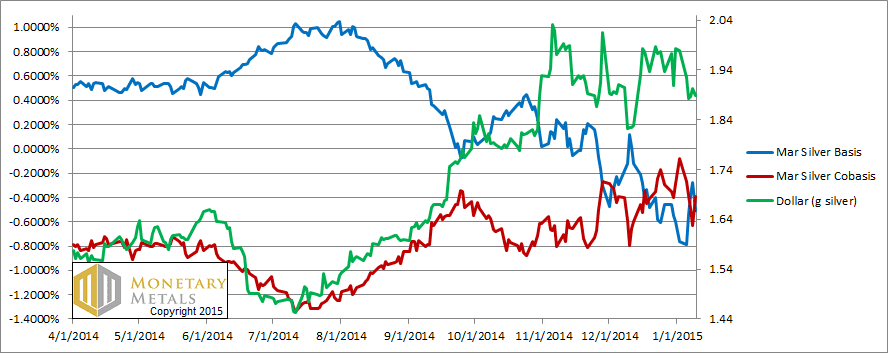
With the falling dollar (measured in silver, i.e. a rising price of silver as measured in dollars) the cobasis has dropped significantly. It dropped for farther contracts too.
Like it or not, we observe yet again the same pattern. A price change corresponds to a change in the bases. Speculators are repositioning and it shows in the data. Could they take the silver price all the way to $17? You bet (well, we don’t recommend this bet). How about $18 or $19? Wouldn’t surprise us in the least (well $19 is less likely than $18 and that’s less likely than $17).
There’s just one problem, if you rely on speculators to take the price up. They are using leverage, and they need to sell sooner or later. Either to take profits (as they reckon them, in dollars) or to cut losses. They can’t do all the heavy lifting without hoarders of metal. A falling cobasis along with a rising price means that hoarders are either buying less, or selling more.
In gold, we calculate a fundamental price a few bucks above the current market price. In silver, it’s about a buck fifty below the current market.
© 2015 Monetary Metals
Thanks Keith. I have a question please: with LBMA about to stop publishing GOFO rates, where can I go to get info on backwardation, other than through your report of course – I like to look daily to help with my positioning. Thanks!
Music: I am not aware of anything else. Stay tuned for a product announcement soon… ;)
Thanks brother :)
Hi Keith
Thanks for your weekly report and I found the Oil S&D very interesting as well. I live in Vancouver and I receive your report at Sunday 22h00 PT. Based on what time’s data do you present your report. I want to make sure I am not trading on too old information, as the gold market opens at 15h00 PT on a Sunday.
Cheers
David: The Report is released on Sunday, and covers the prior week Mon-Fri.
Thanks Keith
Do you offer a paid service whereby one can receive the report prior to 15h00 PT / 13H00 CT, as this is when the Gold markets start trading
Cheers