
Monetary Metals Supply and Demand Report: 12 Jan, 2014
On Friday morning, the Non-Farm Payroll report was released. Instantly, the euro spiked 90 cents, silver spiked 44 cents, and every other asset class reacted. Was this buying of gold and silver by hoarders, who decided to raise their bid by 2%? Or was it speculators using leverage to trade their tired Quantity Theory of Money idea—that if the money supply rises then so shall the prices of gold and silver? And if the payroll report was bad, then surely the Fed shall increase the money supply even more… Read on.
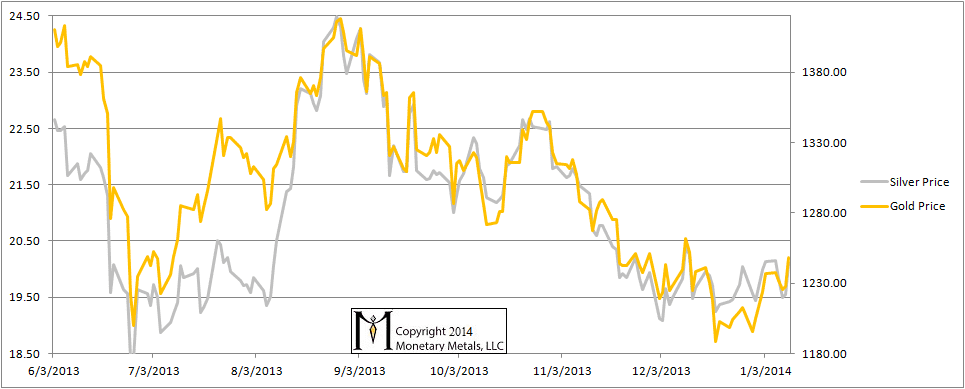
On the week, the gold price was up twelve bucks and the silver price was down half a penny. Accordingly, the gold to silver ratio was up a bit.
Here is the graph of the metals’ prices.
The Prices of Gold and Silver
We are interested in the changing equilibrium created when some market participants are accumulating hoards and others are dishoarding. Of course, what makes it exciting is that speculators can (temporarily) exaggerate or fight against the trend. The speculators are often acting on rumors, technical analysis, or partial data about flows into or out of one corner of the market. That kind of information can’t tell them whether the globe, on net, hoarding or dishoarding.
One could point out that gold does not, on net, go into or out of anything. Yes, that is true. But it can come out of hoards and into carry trades. That is what we study. The gold basis tells us about this dynamic.
Conventional techniques for analyzing supply and demand are inapplicable to gold and silver, because the monetary metals have such high inventories. In normal commodities, inventories divided by annual production can be measured in months. The world just does not keep much inventory in wheat or oil.
With gold and silver, stocks to flows is measured in decades. Every ounce of those massive stockpiles is potential supply. Everyone on the planet is potential demand. At the right price. Looking at incremental changes in mine output or electronic manufacturing is not helpful to predict the future prices of the metals. For an introduction and guide to our concepts and theory, click here.
Here is a graph of the gold price measured in silver, otherwise known as the gold to silver ratio. It’s up a bit this week
The Ratio of the Gold Price to the Silver Price

For each metal, we will look at a graph of the basis and cobasis overlaid with the price of the dollar in terms of the respective metal. It will make it easier to provide terse commentary. The dollar will be represented in green, the basis in blue and cobasis in red.
Here is the gold graph.
The Gold Basis and Cobasis and the Dollar Price
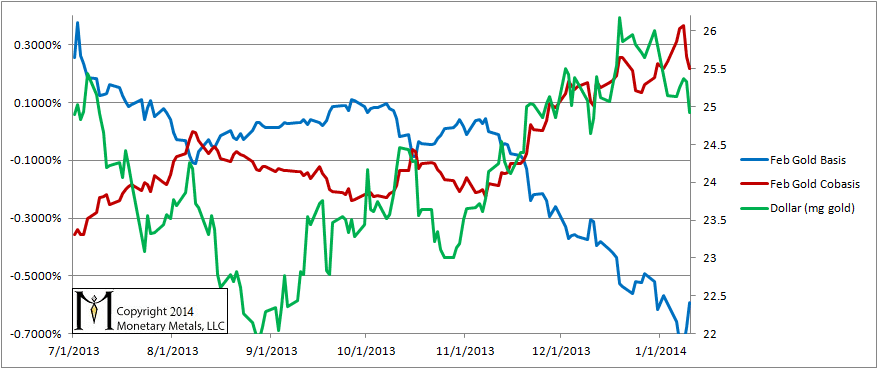
The dollar fell this week to just under 25mg. Now the cobasis is falling, though it seems a bit reluctant. The Feb cobasis is quite a bit higher than it was the last time the dollar was below 25mg in December, though this should be chalked up to the pull of temporary backwardation. The Feb contract is nearing First Notice Day. The cobasis on farther gold contracts has not really moved much since late November.
In other words, the gold price is up about $50 with little effect on the cobasis. The balance of supply and demand hasn’t changed much with the price up 4%. This is not necessarily a strong signal that the gold price has to shoot up rapidly from here (though we believe the neutral price of gold under current conditions is just under $1400). But it is a change from the pattern of several months where every price change was accompanied by the opposite move in the cobasis.
Now let’s look at silver.
The Silver Basis and Cobasis and the Dollar Price
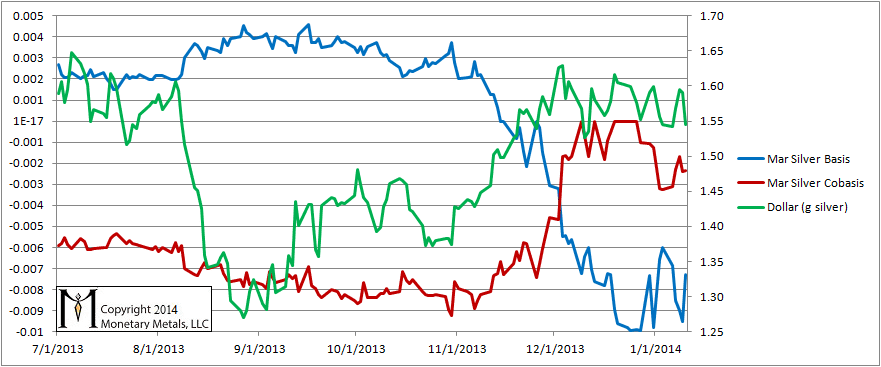
The dollar didn’t change, as measured in silver terms. The cobasis is up a little, though as with gold this is the tug of temporary backwardation and does not occur in farther-out silver contracts.
We continue to say caveat emptor regarding silver. Friday’s move is a good reason why we always say never naked short the monetary metals. Could there be more such moves, especially if the charts begin to show momentum? Sure. Would we bet on it? Not with real money, nor even with Federal Reserve notes.
© 2014 Monetary Metals
I suggest that, for gold, you look at the gold to oil ratio. Over 100 years, it’s pretty steady (plus or minus 20%) at 14. The price of oil is directly related to demand. The hypothesis is that the suppliers of oil are indifferent between holding gold or holding oil, at the ratio.
Check it out.
Gene, PhD economic
Keith:
Thanks so much for your patient and persisntent efforts to educade the ‘great unwashed’, myself included, on the significance of the basis and co-basis metrics with regard to the gold and silver markets.
If I take the time to read, and re-read, your posts, I can end up thinking that I have understood what you are saying.
Then, the next time I tune in on you, I sem to need to begin the process all over again. This is NOT your fault, but mine.
I attended Prof. Fekete’s sessions in Canberra back in 2011 (I think it was) and thought at the time that I understood what he was getting at with the ‘basis’ in futures prices. However, you go beyond what he was trying to get across at that time.
I will perserver. Keep trying, and I just may really ‘get it’ at some point.
L. Crissman
What is the meaning of the neutral price of gold? Do you have a ‘neutral’ price for silver?
“. Could there be more such moves, especially if the charts begin to show momentum? Sure. Would we bet on it? Not with real money, nor even with Federal Reserve notes.”
The last sentence is brilliant. :))