
Monetary Metals Supply and Demand Report: 12 Oct, 2014
The dollar dropped this week. The dollar index fell from 86.69 to 85.91. Of course, this is largely driven by the change in the dollar value in euros, as the euro makes up about 58% of the index. The dollar went from €79.88 to €79.19, or just about -1%.
If you’re not an American, don’t worry about answering the following question. It’s for dollar thinkers, to underscore a point. Does it seem weird to measure the dollar in euros? Or does it seem unnatural?
What about the idea of having, say, €100,000 worth of dollars in an account? Does that feel comfortable to say (or to think)?
It’s weird to measure gold in dollars. It should feel uncomfortable to speak of having $100,000 worth of gold. That it doesn’t to most people (yet) is part of the problem.
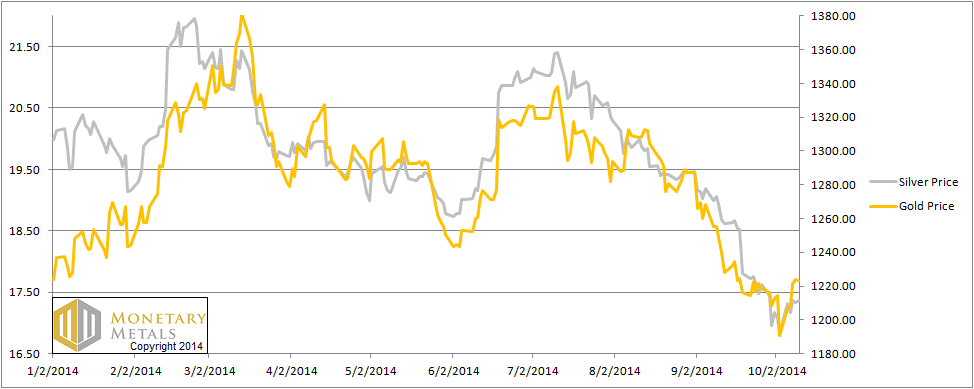
Forget euros. The dollar went down in gold terms, falling from 26.12mg to 25.43mg, or -2.6%. In silver terms, the dollar fell from 1.85g to 1.79g, or -3.2%.
Dollar thinkers will say that gold went up from $1,191 to $1,223 and silver went up from $16.82 to $17.37. We beg to differ that gold goes anywhere, though we agree silver went up slightly from .0141oz gold to 0.0142oz.
What’s next? Read on…
First, here is the graph of the metals’ prices.
The Prices of Gold and Silver
We are interested in the changing equilibrium created when some market participants are accumulating hoards and others are dishoarding. Of course, what makes it exciting is that speculators can (temporarily) exaggerate or fight against the trend. The speculators are often acting on rumors, technical analysis, or partial data about flows into or out of one corner of the market. That kind of information can’t tell them whether the globe, on net, hoarding or dishoarding.
One could point out that gold does not, on net, go into or out of anything. Yes, that is true. But it can come out of hoards and into carry trades. That is what we study. The gold basis tells us about this dynamic.
Conventional techniques for analyzing supply and demand are inapplicable to gold and silver, because the monetary metals have such high inventories. In normal commodities, inventories divided by annual production can be measured in months. The world just does not keep much inventory in wheat or oil.
With gold and silver, stocks to flows is measured in decades. Every ounce of those massive stockpiles is potential supply. Everyone on the planet is potential demand. At the right price. Looking at incremental changes in mine output or electronic manufacturing is not helpful to predict the future prices of the metals. For an introduction and guide to our concepts and theory, click here.
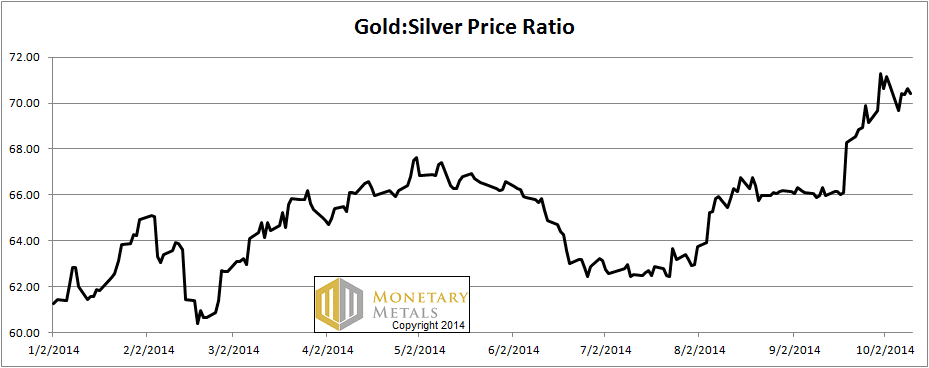
Next, this is a graph of the gold price measured in silver, otherwise known as the gold to silver ratio.
The Ratio of the Gold Price to the Silver Price
For each metal, we will look at a graph of the basis and cobasis overlaid with the price of the dollar in terms of the respective metal. It will make it easier to provide terse commentary. The dollar will be represented in green, the basis in blue and cobasis in red.
Here is the gold graph.
The Gold Basis and Cobasis and the Dollar Price
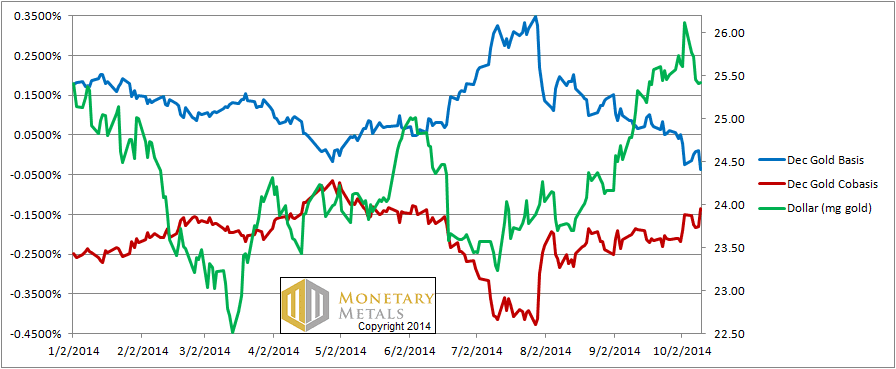
This week, we may be seeing the early signs of a trend change. While the dollar fell, the cobasis went up. Not a lot, but gold got just a bit scarcer while its price went up.
Now let’s look at silver.
The Silver Basis and Cobasis and the Dollar Price
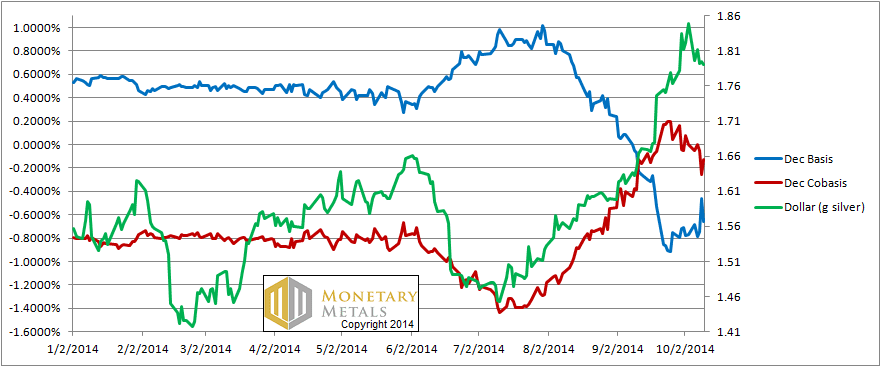
The dollar fell significantly in silver terms this week, in other words the silver price rose. Now’s it’s well over $17 again.
However, whereas we had backwardation a few weeks ago, with the cobasis peaking at about +0.2% on Thursday Sep 25 and last Friday we had a cobasis of exactly 0.0000, this week we ended with a cobasis of -0.13%.
The silver price rose but the cobasis dropped. That means speculators drove up the price, when they bought futures.
Keith would love to meet readers face to face at The Gold Standard Institute’s event The Gold Standard: Both Good and Necessary, in Manhattan on Nov 1. There hasn’t been a real recovery from the crisis of 2008. The reason is not simply that the Fed has made a particular mistake. The cause of the crisis is the dollar itself. There will not be a recovery until we return to the use of gold as money. Please come to this talk to hear his diagnosis of the dollar and urgent prescription for gold.
© 2014 Monetary Metals

This is like brain training. I always have to beat into my head to stop thinking of value, or net worth in dollar or RMB terms (my 2 most commonly used currencies), instead to think in weights.
I love this:
Dollar thinkers will say that gold went up from $1,191 to $1,223 and silver went up from $16.82 to $17.37. We beg to differ that gold goes anywhere, though we agree silver went up slightly from .0141oz gold to 0.0142oz.”
Very proper.
Thanks for your comment Max.
It’s a paradigm shift. Explaining a paradigm shift (once you have really though it through) is pretty easy and can be done in a paragraph. What’s hard is for others to really get their heads around it.
I saw the same thing with my first company, DiamondWare, and our 3D voice technology. “So it’s a conference bridge.” That is a lot like “So gold is going up.”