Monetary Metals Supply and Demand Report: 13 Apr, 2014
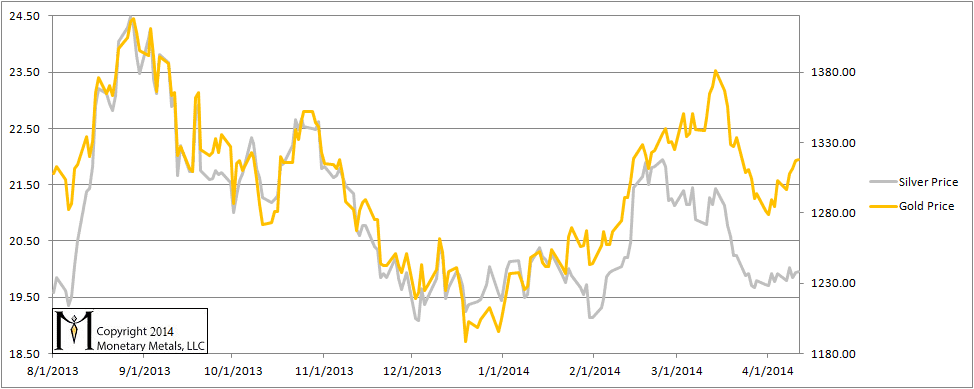
On Wednesday, the Federal Open Market Committee released the minutes of their last meeting. This news helped make a good week for gold speculators. An ounce of gold now exchanges for 16 bucks more than it did at the close last Friday. That’s about 1.5% more of our favorite green paper, for those who count the worth of gold in terms of such things.
Silver speculators, on the other hand, may want to invest in the stock of antacid manufacturers. Their favorite metal quickly commanded 22 more pennies per ounce. The silver price kept rising and then in the wee hours, there was another spike, this one adding 28 more copper-coated zinc slugs to the stack exchangeable for an ounce of silver. However, after the original reaction, the silver price relentlessly dropped back. At week’s end, silver goes for just three more cents than it did a week ago.
And what did the FOMC say? They clarified that they won’t hike interest rates as quickly as some people may have assumed. Who jumped on this non-news news? Was it stackers who were waiting for the ideal moment to splurge on buying more metal?
If we seem a bit negative about speculation in gold and silver, it’s because most of this speculation is based on the flawed belief that the dollar is money and the monetary metals are just toys, volatile commodities to use just to get more dollars. So long as people trade on this belief, the prices of the metals will be volatile as hell.
Everyone wishing that those other people would stop, so they can finally realize the big gain they’re hoping for—$5,000 per ounce, $10,000, $30,000 or whatever—is contributing to the problem.
It’s not gold that is volatile, but the dollar that we presume to use to measure it.
For this week’s market data, read on…
First, here is the graph of the metals’ prices.
We are interested in the changing equilibrium created when some market participants are accumulating hoards and others are dishoarding. Of course, what makes it exciting is that speculators can (temporarily) exaggerate or fight against the trend. The speculators are often acting on rumors, technical analysis, or partial data about flows into or out of one corner of the market. That kind of information can’t tell them whether the globe, on net, hoarding or dishoarding.
One could point out that gold does not, on net, go into or out of anything. Yes, that is true. But it can come out of hoards and into carry trades. That is what we study. The gold basis tells us about this dynamic.
Conventional techniques for analyzing supply and demand are inapplicable to gold and silver, because the monetary metals have such high inventories. In normal commodities, inventories divided by annual production can be measured in months. The world just does not keep much inventory in wheat or oil.
With gold and silver, stocks to flows is measured in decades. Every ounce of those massive stockpiles is potential supply. Everyone on the planet is potential demand. At the right price. Looking at incremental changes in mine output or electronic manufacturing is not helpful to predict the future prices of the metals. For an introduction and guide to our concepts and theory, click here.
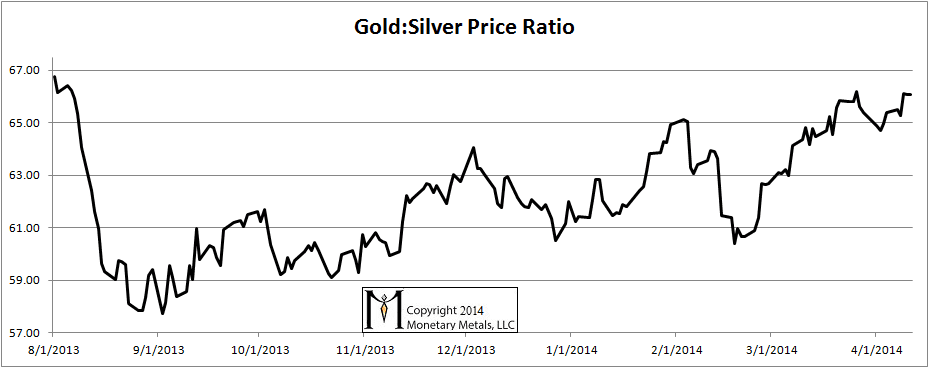
Next, this is a graph of the gold price measured in silver, otherwise known as the gold to silver ratio. The ratio moved up about 1%.
The Ratio of the Gold Price to the Silver Price
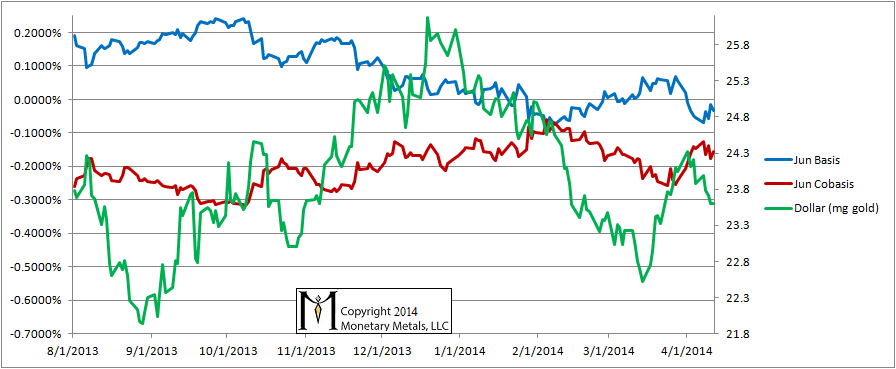
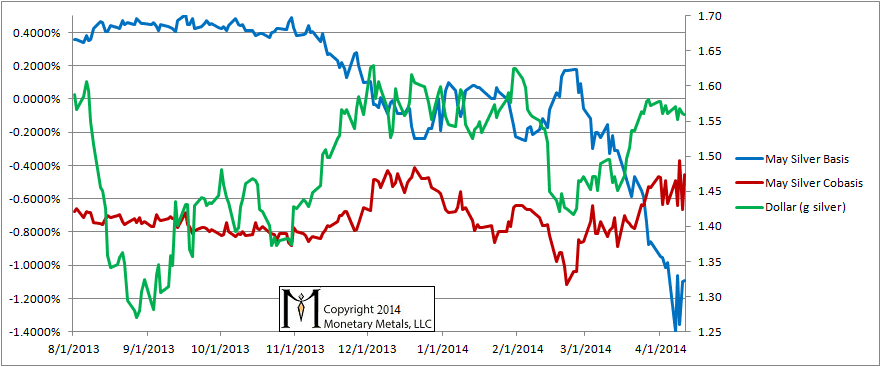
For each metal, we will look at a graph of the basis and cobasis overlaid with the price of the dollar in terms of the respective metal. It will make it easier to provide terse commentary. The dollar will be represented in green, the basis in blue and cobasis in red.
Here is the gold graph.
The Gold Basis and Cobasis and the Dollar Price
The dollar fell a bit (i.e. the gold price rose). And the cobasis fell. As we implied at the top of the report, speculators drove the action this week. They bought futures up a little, and the basis rose a little / cobasis fell a little.
Now let’s look at silver.
The Silver Basis and Cobasis and the Dollar Price
The speculators’ fingerprints are all over the basis and cobasis on Thursday. The basis was up +0.26% and the cobasis dropped 0.29%. These are big moves. They represent a speculator buying a future and an arbitrager reluctantly buying metal and shorting a future, with the key word being reluctant.
On Friday, when silver had sold off almost 20 cents, the cobasis was back up again though not to where it had been. The basis did not fall; it was actually up a smidge more.
We end with an interesting postscript, an anecdote about silver speculators still clinging to hope. We have been saying for a long time that the neutral price of this metal is far below the current market price, but speculators keep betting on it anyway. This week, we published Gold and Silver Speculation. The reaction from the silver speculative community was, shall we say, pretty strong.
We are watching bond defaults in China, a plunging Baltic Dry shipping index, falling currencies all over the world, and other signs of contracting credit and contracting manufacturing. Added to this, we now have had a drop in the US stock market. Against this backdrop, who would want to bet that silver will rise in dollar terms or that it will outperform gold?
© 2014 Monetary Metals


Keith,
Thanks for the update. Have you any thoughts on GOFO 1 and 2 months have gone negative and the 12 month down to the lowest level I have noticed for quite some time. I think I remember you saying that the rot will have really set in if the far out months go into backwardation.
Cheers,
Knackers
knackers: Thanks for your comment.
It has been a while since I plotted GOFO against the gold basis (https://monetary-metals.com/what-drives-negative-gofo-and-temporary-gold-backwardation/) but they correlate highly.
A negative basis or GOFO means that you lose money if you try to carry gold. That said, I think a positive cobasis is a better criteria for backwardation than a negative basis. A positive cobasis means there is a profit to be made in decarrying the metal.
We’re close, but not there yet. What’s interesting is that the cobases for all the contracts in through 2014 are jumbled up in the -0.15% to -0.2%. I don’t recall them all being so close or so high before. The Dec 2015 cobasis is just -0.3%, so there is hardly any downslope.
Is it any wonder that open interest in gold is so low?
Maybe it’s time Keith to short silver futures with leverage, a sure bet isn’t it ?
Keith,
GOFO are quite negative now , The 12 months while being positive is probably at his lowest point ever , it seems it doesn’t match your basis/cobasis analyses as the JUne cobasis is not positive . Any clarification please ?
Thank you