
Monetary Metals Supply and Demand Report: 13 July, 2014
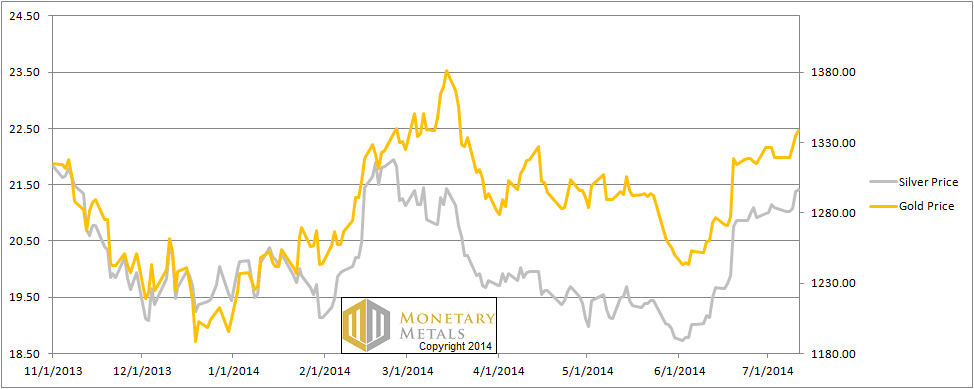
Does a $19 price hike in gold count as “fireworks”? How about 32 cents in silver? No? Well, then there were no fireworks in the prices of the metals this week. For the supply and demand fundamentals, read on…
First, here is the graph of the metals’ prices.
The Prices of Gold and Silver
We are interested in the changing equilibrium created when some market participants are accumulating hoards and others are dishoarding. Of course, what makes it exciting is that speculators can (temporarily) exaggerate or fight against the trend. The speculators are often acting on rumors, technical analysis, or partial data about flows into or out of one corner of the market. That kind of information can’t tell them whether the globe, on net, hoarding or dishoarding.
One could point out that gold does not, on net, go into or out of anything. Yes, that is true. But it can come out of hoards and into carry trades. That is what we study. The gold basis tells us about this dynamic.
Conventional techniques for analyzing supply and demand are inapplicable to gold and silver, because the monetary metals have such high inventories. In normal commodities, inventories divided by annual production can be measured in months. The world just does not keep much inventory in wheat or oil.
With gold and silver, stocks to flows is measured in decades. Every ounce of those massive stockpiles is potential supply. Everyone on the planet is potential demand. At the right price. Looking at incremental changes in mine output or electronic manufacturing is not helpful to predict the future prices of the metals. For an introduction and guide to our concepts and theory, click here.
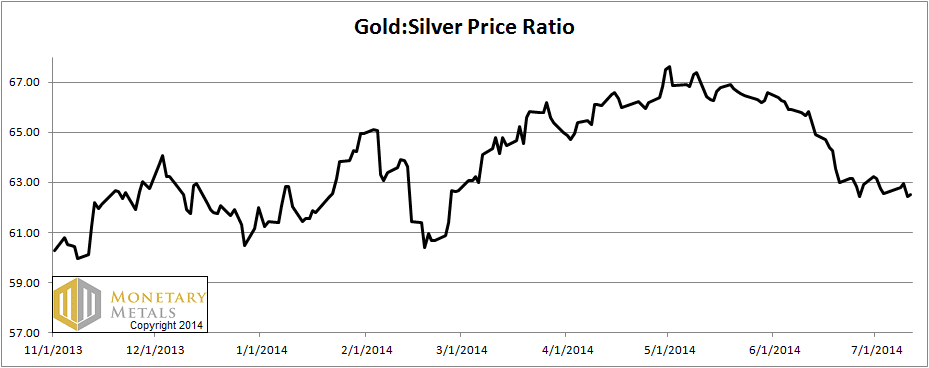
Next, this is a graph of the gold price measured in silver, otherwise known as the gold to silver ratio. The ratio moved was unchanged this week.
The Ratio of the Gold Price to the Silver Price
For each metal, we will look at a graph of the basis and cobasis overlaid with the price of the dollar in terms of the respective metal. It will make it easier to provide terse commentary. The dollar will be represented in green, the basis in blue and cobasis in red.
Here is the gold graph.
The Gold Basis and Cobasis and the Dollar Price
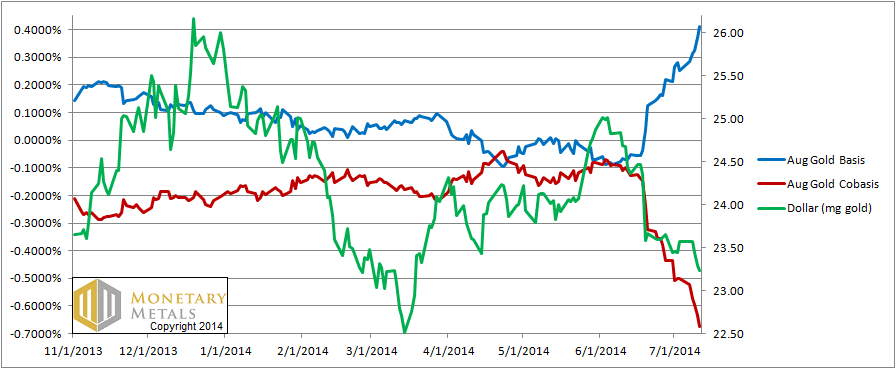
How long ago was it that we wrote of there being no profit to carry gold (i.e. buy bars and sell futures contracts against them)? Well, now for August delivery, you can make 41 basis points (it’s a steady 30ish basis points for farther contracts all the way out to Dec 2015). The cobasis continues its collapse, from -50 to -67 basis points.
The neutral price in gold is now below the market price, the first time since the end of March 2013.
There has been a significant increase in abundance and decrease in scarcity.
Now let’s look at silver.
The Silver Basis and Cobasis and the Dollar Price
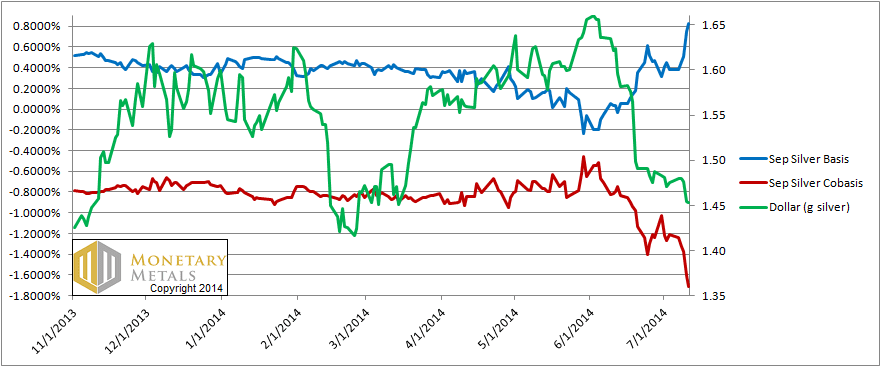
This week, the silver basis (abundance) made up for the time it lost last week. It rose from 38 basis points to 82. The cobasis continued its collapse, from -121 basis points to -171.
Last week, we said silver has “strong supply and weak demand”. This week, they’re stronger and weaker, respectively.
It’s important to remember why a rising basis indicates abundance. It means that the metal is so plentiful, that it’s available to anyone who wants to carry it. The marginal buyer is the warehouseman. The marginal demand is to go into warehouses. What happens when this reverses, and the warehouse becomes the marginal supply?
We saw one analyst this week noting that money was coming into futures in the precious metals markets. That writer put a bullish interpretation on it. The more objective way to look at it is that futures are bought on credit. Credit has poured into this market. This credit has pushed up the prices of gold and silver 19 bucks and 32 pennies, respectively. What happens when the direction reverses, when credit is rushing for the exit?
© 2014 Monetary Metals
Hoi,
Keith, you’re right.
Speculative bull run disappears.
The conditions were super but disappeared perhaps in arbitrage.
Conditions now, look bad , especially in silver.
A Flash in the Pan
I think this abundance comes from Germany and Ecuador central banks’ new sovereign gold management policy:
http://www.bloomberg.com/news/2014-06-23/german-gold-stays-in-new-york-in-rebuff-to-euro-doubters.html
http://www.bloomberg.com/news/2014-06-02/ecuador-sends-gold-reserves-to-goldman-sachs-in-liquidity-hunt.html
… but how long will it last?
Keith, could you explain what you called the “neutral price in gold” ?
More and more convincing your analysis doctor Keith…Now the question is why on earth the real thing is so “abundent” is quite a mystery
As I look now, the DJ has just hit a new high and gold is smashed about $32. Silver is down the exact same % at 2.43%. Coincidence? I don’t know.
Maybe players who hold metal decided they need cash to ride the bull in the Dow.
Maybe they just sold because they think both are going to go down and they will buy back later.
Maybe they just need cash now.
That’s a lot of maybe’s. One thing is for sure,this whole subject is difficult for me to get my head around.
S
Thanks for your work. You were one of the few people calling for caution when others were saying to jump on the bandwagon. Do you have a longer term chart showing the basis and cobasis for gold over 5 or more years? I think it would be helpful for me to see how it works when gold is at extremes.
Cheers and thanks.
Thanks, Keith, always an interesting look on the market.
What do you think about the current backwardation in copper at the Shanghai Futures Exchange. Just a local insignificant phenomenon?
https://www.bullionstar.com/article/chinese%20gold%20demand%20973%20my%20ytd%20copper%20in%20backwardation
KJ
Historically, how big is this move in the basis and cobasis ? It seems like the biggest move for quite some time. Didn’t something similar happen before Lehman ?