
Monetary Metals Supply and Demand Report: 14 Sep, 2014
We saw one headline this week that merits comment. We have no idea if this represents sentiment among the gold bugs, but it’s interesting.
The strong dollar undermines gold.
We presume this refers to the price, as gold was money for thousands of years prior to the dollar and will continue to be money for thousands of years after the dollar. We are in a temporary anomaly, a dollar bubble, in which people think of the value of gold in terms of its dollar price.
It’s clearer to say that the dollar rose this week, from 24.5mg gold to 25.33mg. How high can the dollar go? That depends on the pressure on debtors, and what central banks may next attempt in order to relieve it.
For the fundamentals, read on…
First, here is the graph of the metals’ prices.
The Prices of Gold and Silver
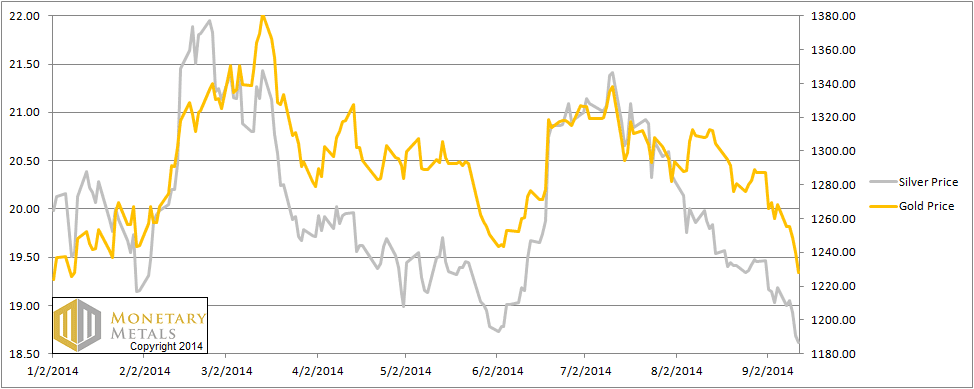
We are interested in the changing equilibrium created when some market participants are accumulating hoards and others are dishoarding. Of course, what makes it exciting is that speculators can (temporarily) exaggerate or fight against the trend. The speculators are often acting on rumors, technical analysis, or partial data about flows into or out of one corner of the market. That kind of information can’t tell them whether the globe, on net, hoarding or dishoarding.
One could point out that gold does not, on net, go into or out of anything. Yes, that is true. But it can come out of hoards and into carry trades. That is what we study. The gold basis tells us about this dynamic.
Conventional techniques for analyzing supply and demand are inapplicable to gold and silver, because the monetary metals have such high inventories. In normal commodities, inventories divided by annual production can be measured in months. The world just does not keep much inventory in wheat or oil.
With gold and silver, stocks to flows is measured in decades. Every ounce of those massive stockpiles is potential supply. Everyone on the planet is potential demand. At the right price. Looking at incremental changes in mine output or electronic manufacturing is not helpful to predict the future prices of the metals. For an introduction and guide to our concepts and theory, click here.
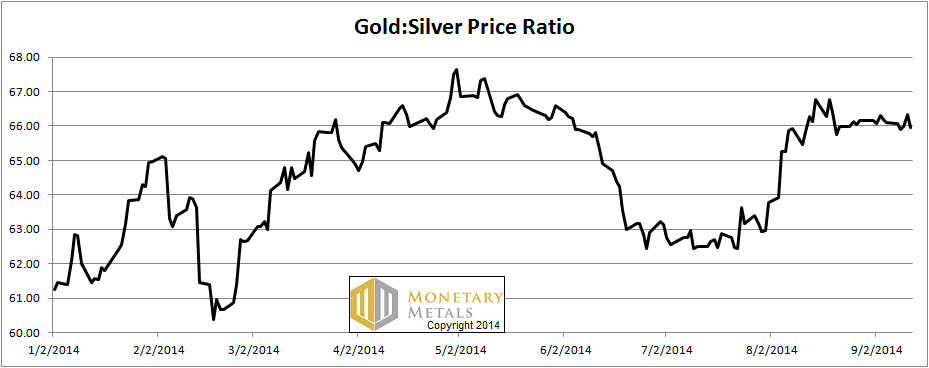
Next, this is a graph of the gold price measured in silver, otherwise known as the gold to silver ratio. The ratio barely budged.
The Ratio of the Gold Price to the Silver Price
For each metal, we will look at a graph of the basis and cobasis overlaid with the price of the dollar in terms of the respective metal. It will make it easier to provide terse commentary. The dollar will be represented in green, the basis in blue and cobasis in red.
Here is the gold graph.
The Gold Basis and Cobasis and the Dollar Price
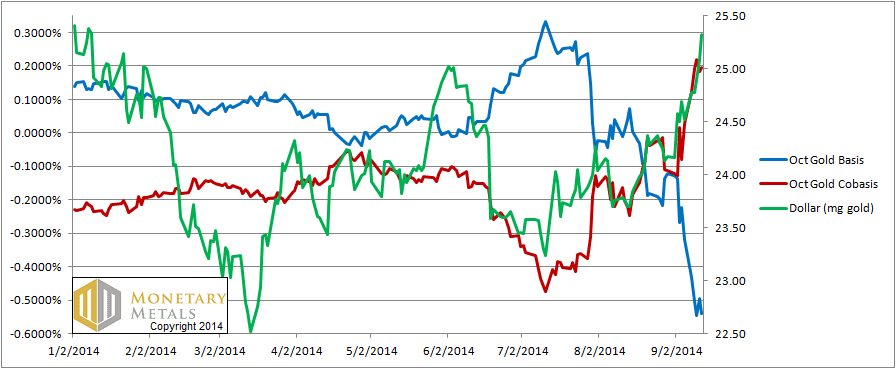
The cobasis (i.e. scarcity) and the dollar price (i.e. inverse of the gold price measured in dollars) continue to be correlated, though the cobasis did not continue to rise after Wednesday.
The October gold contract is backwardated now, and it’s not so small at about 0.2%.
Last week, we said:
Speculators have sold gold futures down, so now (at $1265) there is a hint of more serious scarcity developing. This does not mean the price couldn’t go lower, but it will be a force pushing upwards on the gold price. If the backwardation increases, that force will increase.
Now the price is $1228, and the scarcity has increased though it’s still well within the post-2008 new normal. It is temporary backwardation, with the December gold cobasis still down at -0.2%.
Now let’s look at silver.
The Silver Basis and Cobasis and the Dollar Price
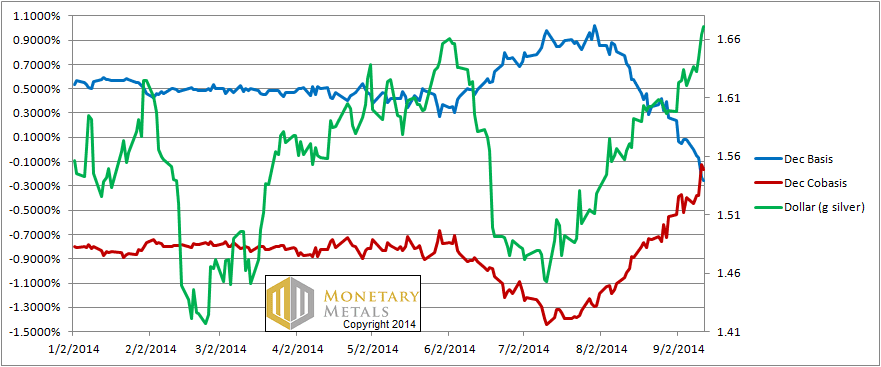
In, silver the cobasis shot up on Thursday. It’s still in negative territory, but not by a lot any more. If this trend continues, we may need to reverse our long bearish stance on silver, both in gold terms and quoted in dollars too.
There is one factor that causes us to hesitate. This chart is courtesy of our friends at Sharelynx.
Inventory, in ounces, at SLV
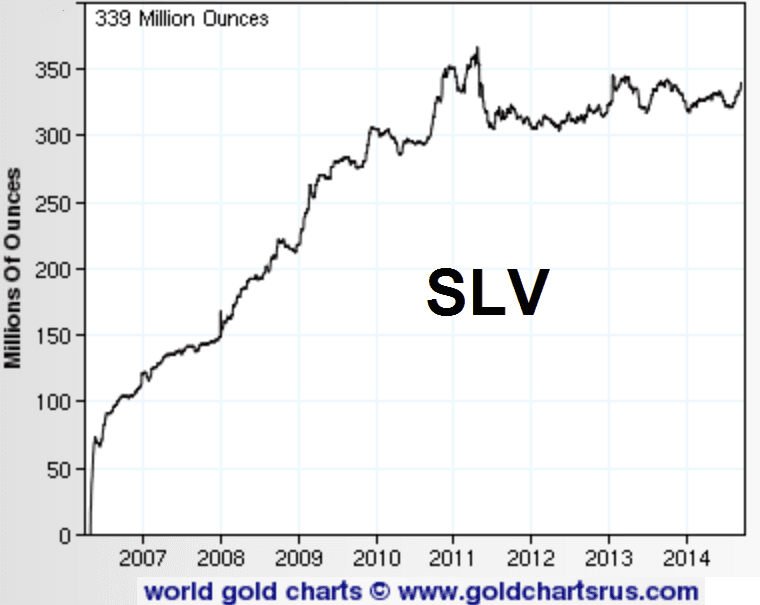
Aside from one dip, inventories at the silver ETF, SLV, have been rising all year and are now basically at the high following the collapse in the silver price in 2011. It’s hard to make out the precise timing of the dip, but we would bet that it lines up perfectly with the dip in the cobasis that occurred during the month of June.
The ETF inventory level does not correlate so closely with price. Instead, it serves as a rough proxy for speculative demand. Why is this?
SLV shares are created by Authorized Participants when the price of a share is above the price of the metal it represents. The AP makes a small spread by buying metal and selling newly created SLV shares. The AP will repeat this arbitrage until the gap between SLV and the silver spot price is closed (we wrote about this last year).
The price of SLV can go up or down based on buying and selling of shares on the NYSE. This arbitrage by the APs is the force that keeps the price of a share of SLV close to the price of the metal backing it. The APs keep them so close, in fact, that unless you are a student of market mechanics, you could ignore this action entirely.
The bottom line is that if inventory is increasing, it means that there is steady buying pressure on the ETF shares that does not exist in the spot market for the metal. Sound familiar?
The ETF inventory is not nearly so precise an indicator as the basis and cobasis. But it is measuring something close to the same thing. When someone buys real, physical metal, it’s not typically a short-term speculation on price. Whatever his reasons, he is typically taking the metal off the market for a while, if not permanently.
The buyer of a future is using leverage, and he is the opposite. He is not interested in metal. He is all about a rising price. Just witness the complaints about manipulation causing lower prices. If he were accumulating metal for the value of the metal, as opposed to seeking dollar gains, he would not pay so much attention to conspiracy theories. If anything, he would be happy that someone is enabling him to buy more than he would otherwise be able to buy.
The buyer of SLV is somewhere in between the buyer of metal and the leveraged speculator. He cannot get metal, so that leaves price speculation as motive. The difference is that the stock market does not generally allow the same degree of leverage as the futures market.
We are inclined to take heed of the high level and rising trend of the SLV inventories, particularly now that the silver cobasis has risen out of proportion to the rise in the dollar price, quoted in silver. In early July, the dollar was 1.47g silver and the cobasis was -1.2%. Now, the dollar has risen to 1.67g but the cobasis has shot up almost to -0.1%.
We attribute some of the rise in cobasis, i.e. rise in scarcity, to silver speculators using the stock market to place their bets. By eye, this chart shows a rise since the July low of about 15M ounces. It feels like a substantial amount. To put it in perspective, the drop in inventory following the 2011 crash was perhaps 60M ounces. The rise since July is ¼ that amount.
Could that make the cobasis rise as much as it has? We don’t know. There isn’t a nice linear formula to equate an aggregate quantity to a spread (e.g. the basis), or a change in quantity to a change in spread. It made it rise for sure, though we cannot say how much.
It is interesting that so much ETF buying has been unable to hold the silver price at $21, $20, or even $19. Should that buying turn to selling, we will see a falling cobasis and a crash in the price.
As always, the $64B question is: will these ETF holders be inclined to sell? Or, perhaps more accurately, when will they likely sell?
Our basis analysis does not attempt to figure out market psychology. That is the domain of technical analysis. The basis can tell us that, in gold, the price changes these past several months have been nothing more than speculators repositioning themselves. When they bet on a rising price by buying futures, they drive the price up. At the new, higher price the metal becomes more abundant. The opposite happens when they become more bearish. The same is basically true in silver, though recently the rise in the cobasis has been disproportionate to the fall in the silver price.
The silver price could break either way. We would not be inclined to put capital in harm’s way this week.
© 2014 Monetary Metals
iShares reports its SLV “Silver Bar List” with “Total Bullion Weightlist” here,
https://ebts.jpmorgan.com/metalicsWebApp/ebts_downloads/BONY_SLV.pdf
As of Friday, Sept. 12, the total is 336,133,727.7 troy oz., up from 334,646,546.5 oz.
on Sept. 10 & 11, 333,207,959.8 oz. on Sept. 5, and a recent low of 321,837,128.6 oz.
on Aug. 5.
I don’t know how Sharelynx could show a recent 339 million oz. (shown in its graph above).
From its inception in April 2006, iShares reported daily historical SLV metal holdings,
but this reporting ended about about April 1, 2014, when iShares re-designed its
Website. It claims to be working to restore this historical record. Meanwhile,
one can get daily holdings at the above link. The file is large, nearly 800 kB, so it
is not a quick download for some of us.
drdavis: Thanks for your comment. I will inquire with Sharelynx to see what they say.
Sharelynx responded. They get their data daily from: http://www.ishares.com/us/products/239855/ishares-silver-trust-fund. They think that JPM may post the data one day behind, as their number matches what Sharelynx had on Thursday.
Certainly some motivation for complaints of manipulation causing lower prices is due to having one’s physical holdings artificially devalued in currency terms, the breakdown of rule of law, and the loss of an equitable price discovery mechanism that can be trusted. If one does have serious concerns about the long term viability of a fiat currency regime, it is true that that new bullion accumulations at lower currency valuation should be welcomed, but that does not mean that seriously suspect market function should not be decried.
All in all, Monetary Metals provides unique and fascinating analysis – a tremendous resource! Best regards.
Great great article. Very useful education. This is a fantastic compilation of market data that would take us amateurs a long time to find, analyze and even realize we need to consider.
339 million ounces of physical silver being held by SLV ?
10m kilos
10,000 tons. I cannot imagine that much silver
Are you saying that there are 10,000 tons sitting in storage by SLV and could come onto the market,in part at least.?
steve
Kieth
Has there been any independent audit of slv inventory.
Who can has seen all this silver supposing to exist in
the slv trust. Can we trust?