
Monetary Metals Supply and Demand Report: 15 Dec, 2013
The gold and silver prices recovered about half their drop the previous week, ten bucks in gold and 21 cents in silver. Is this the blastoff of the metals, long heralded in song and hoped-for by goldbug blogs? Read on, and we promise no Obi Wan Kenobe imitations this time…
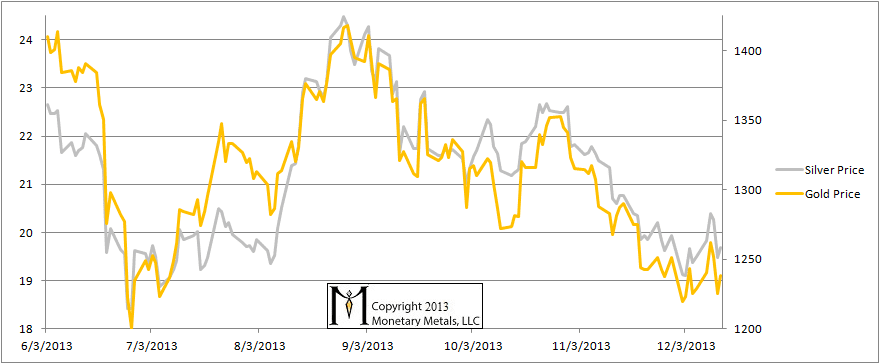
Here is the graph of the metals’ prices.
The Prices of Gold and Silver
We are interested in the changing equilibrium created when some market participants are accumulating hoards and others are dishoarding. Of course, what makes it exciting is that speculators can (temporarily) exaggerate or fight against the trend. The speculators are often acting on rumors, technical analysis, or partial data about flows into or out of one corner of the market. That kind of information can’t tell them whether the globe, on net, hoarding or dishoarding.
One could point out that gold does not, on net, go into or out of anything. Yes, that is true. But it can come out of hoards and into carry trades. That is what we study. The gold basis tells us about this dynamic.
Conventional techniques for analyzing supply and demand are inapplicable to gold and silver, because the monetary metals have such high inventories. In normal commodities, inventories divided by annual production can be measured in months. The world just does not keep much inventory in wheat or oil.
With gold and silver, stocks to flows is measured in decades. Every ounce of those massive stockpiles is potential supply. Everyone on the planet is potential demand. At the right price. Looking at incremental changes in mine output or electronic manufacturing is not helpful to predict the future prices of the metals. For an introduction and guide to our concepts and theory, click here.
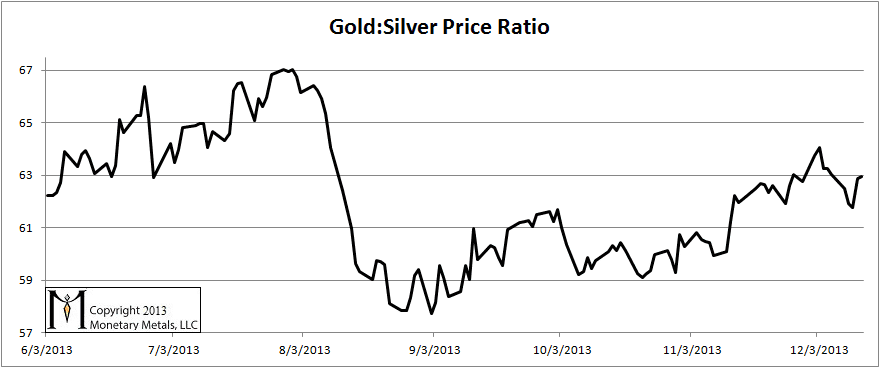
Here is a graph of the ratio of the gold price to the silver price. This shows how many ounces of silver one needs, to buy an ounce of gold. The ratio fell by a hair.
The Ratio of the Gold Price to the Silver Price
For each metal, we will look at a graph of the basis and cobasis overlaid with the price of the dollar in terms of the respective metal. It will make it easier to provide terse commentary. The dollar will be represented in green, the basis in blue and cobasis in red.
Here is the gold graph. The February cobasis is still backwardated.
The Gold Basis and Cobasis and the Dollar Price
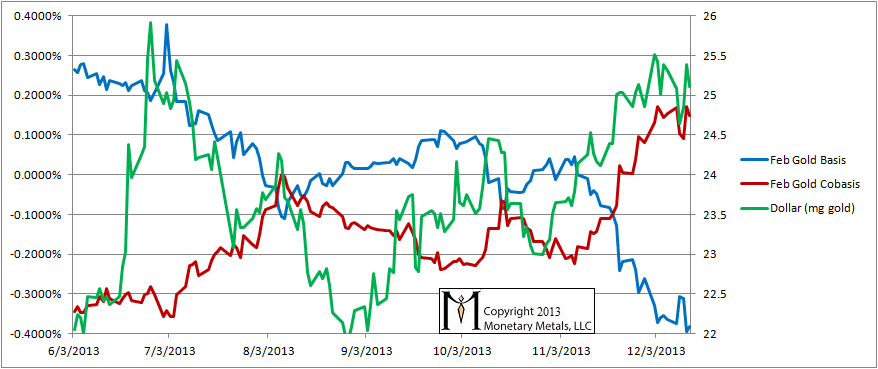
The correlation between the gold cobasis and the price of the dollar is glaringly obvious. No need to draw lines this week. Not much has changed in the supply and demand of gold. The price hasn’t moved much, but we can see its moves are driven leveraged speculators. Will they bid gold up to $1300 this week or sell it down to $1200? Maybe. They could. This Report is not about speculating on such things. What we are about is looking at a clear picture that few people watch.
The gold market is not as tight today, as it was in early August. The gold price is now $60 to $100 lower. For whatever reasons—rumors and whispers and conspiracy theories aside—this is an observable fact. Maybe more people are willing to sell their gold metal in greater quantities now. Perhaps they are less enthusiastic to buy now. Most are dollar thinkers, and are worrying that “gold is going down.”
I often use the analogy of a Ouja Board. Everyone has a thumb on the movable indicator piece (called the “planchette”) and it seemingly moves where it wants to go. Right now, speculators are looking for a direction that they can bet on to make dollars. They would like to front-run durable demand, that is demand by hoarders. Speculators buy in order to sell, whereas hoarders buy to hold. While the former may move the price at the margin for a time, it is the latter who determine whether gold is in the two hundreds, the two thousands, or the fifty thousands.
Right now, the hoarders are not driving it deeper into scarcity, but nor are they letting it become abundant. So what is the likely next move of the gold price?
You may go on an unexpected journey this week, but keep your wits about you and your trusted friends close.
Now let’s look at silver.
The Silver Basis and Cobasis and the Dollar Price
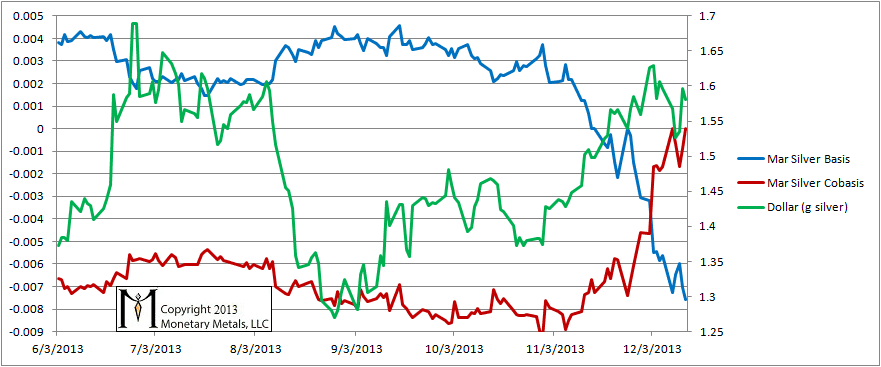
The cobasis of silver is higher than last week, unlike gold, but on the other hand it’s at zero compared to gold’s backwardation. If it continues to rise, then we will change our stance on silver. For the moment, we would not want to wager on silver one way or the other. If forced to take a position, we would be bearish. Call it skepticism that such a quick rise in the cobasis after so long at so low a level won’t pull back. Call it a hunch that the final capitulation has occurred in gold, but not yet in silver. We see the comments on websites, and this week there was an interview with Jim Rogers wherein he said he had sold or hedged his gold but was bullish on silver.
We’re not. Not yet.
© 2013 Monetary Metals
Thank you for being the lighthouse in a sea of too many shipwrecks.
Try plotting the gold:oil price ratio, for the last 100 or so years.
In other words, you believe gold has bottomed out? Possibly a good time to start accumulating?
I highly value your commentaries, but am sorry I have so much trouble understanding.
Thanks for your comments and James for your kind words. :)
bvigorda: I can’t give investment advice but I can clarify why I said above. The gold price has dropped since early August, but the supply and demand dynamic has loosened. Hoarders are less aggressive in buying and/or more aggressive in selling, at $1240 now, than they were in August at $1325.
Could the gold price go lower? It could. Could it go higher? It could. At the moment, supply and demand isn’t changing much, and the price moves are driven by the fickle leveraged speculators.
Thanks Keith. I guess I got caught up on the words “Call it a hunch that the final capitulation has occurred in gold, but not yet in silver.”
I meant that in the sense that my gut feeling is that we are not going to see a massive collapse in the gold price. It seems somewhat more likely in silver.
Thank you
Rising gold cobasis, hence rising scarcity of gold, is correlated to rising dollar (measured in gold ounce)? Why is that? Rising scarcity of gold should be correlated to higher gold price (measured in dollar). I used the term ‘correlated’ as I do not know the causation (whether rising scarcity leads to higher gold price measured in $ OR higher gold price measured in $ leads to rising scarcity due to the giffen good nature of gold). In fact, the basis/ cobasis graph could be at best move closely with or at worst lagging behind the price graph. Please correct me if i am wrong:)
Allen: it just shows that speculators are pushing the price around. When speculators buy, the price rises and at the higher price gold is a bit less scarce. When they sell, the price drops and with it gold availability to the market.
Keith, according to your analysis, the overall pattern seems to be that the higher prices go, the more supply starts hitting the market. Conversely, lower prices tend to make the metals more scarce.
I am not taking issue with your analysis, but simply note that it seems rather counterintuitive that availability should be determined by the price, rather than the other way around. Normally, higher prices are a symptom of shortage in the market, not of abundance, and lower prices are a symptom of abundance, not of shortage.
Your thoughts?
Hi Keith,
Today is my first day on your website as a member.
Thanks for your video that was featured on December 19, 2013 ” Measuring Gold and Silver Supply and Demand”. I appreciate the non-sensational approach to evaluating gold and silver. Also, I learned quite a bit in a few short minutes of the video. Your explanation which gives the “big picture” of supply and demand was quite useful. It has changed my perspective.
I have hoarded gold and silver over the last several years for one simple reason: The purchasing power of the US Dollar seems to have gone down quite a bit in time. This is simply my observation. I don’t know how to calculate the actual figure.
Here’s a question I hope you can answer: As you evaluate the prices of precious metals, how do you factor in the purchasing power of the dollar? It seems logical that if the precious metal prices “in dollars” fall, it is somewhat of a double negative, since those dollars are actually worth less than they were before. It also seems that there’s a handicap to the upside when precious metals increase in dollar value. If the dollars have less buying power, then the increase is diminished.
I realize that the US dollar has no actual value but it is still exchanged for commodities such as precious metals.
Marc
Holidays Greetings Keith