Monetary Metals Supply and Demand Report: 15 Mar, 2015
Last week, we talked about currencies. This week, let’s look at what the dollar is worth. No, we don’t mean purchasing power, which is just the inverse of consumer prices. Every day, every business that wants to remain alive is busy cutting costs. Real prices are in free fall, and some dollar prices too. For a recent example, look at oil.
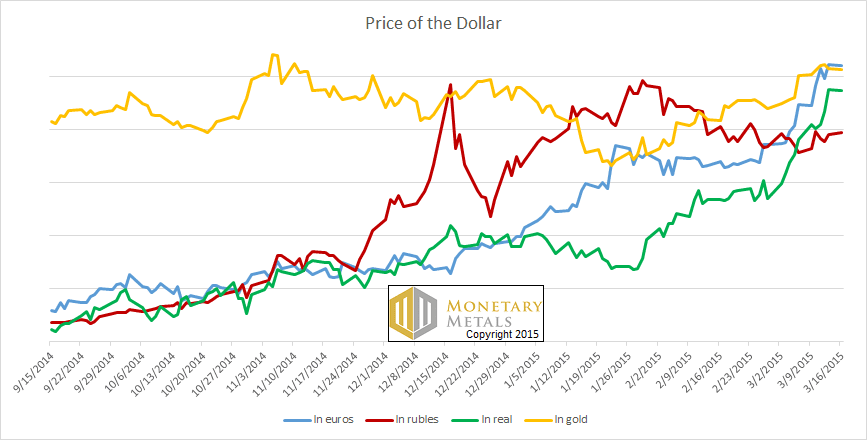
We simply mean what is the dollar worth in terms of what other people think of as money. Perhaps to most readers, the Brazilian real looks like funny money. But to people in Brazil, the real is real money (no pun intended) and the greenback is foreign. Here is a graph of the price of a dollar in a few other currencies, and gold.
That dollar sure is rising. It’s even rising a bit in gold terms (more on this below), but its spectacular rise stands out in terms of euros, rubles, and real.
This is a very real phenomenon, and it is hurting people all over the globe. Their own currencies buy less, but more importantly many businesses and banks borrow dollars. Imagine if your car or mortgage payment were rising like some of the lines on this graph above. That is approximately how dollar borrowers feel outside the US.
This look at credit is useful to our analysis of gold, and especially silver. There are many other factors in the price of gold, but one is credit expansion. Right now, people and financial institutions around the world are under pressure to obtain dollar liquidity.
In the current market, their selling of gold and silver metal is outweighing the buying pressure of those who are warily looking at banking risks, Greek and other government default risks, and other reasons not to be a holder of paper—not to be a creditor.
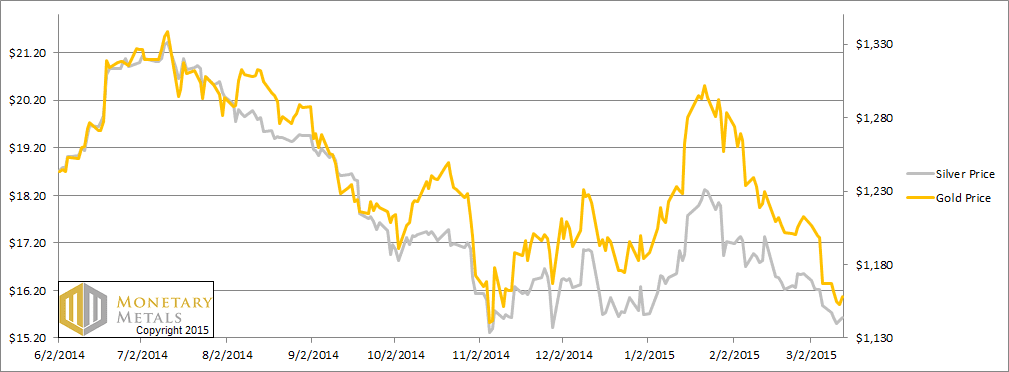
This week, the price of gold fell $9 and the price of silver fell 25 cents.
For a picture of the supply and demand fundamentals of gold and silver, read on…
First, here is the graph of the metals’ prices.
We are interested in the changing equilibrium created when some market participants are accumulating hoards and others are dishoarding. Of course, what makes it exciting is that speculators can (temporarily) exaggerate or fight against the trend. The speculators are often acting on rumors, technical analysis, or partial data about flows into or out of one corner of the market. That kind of information can’t tell them whether the globe, on net, is hoarding or dishoarding.
One could point out that gold does not, on net, go into or out of anything. Yes, that is true. But it can come out of hoards and into carry trades. That is what we study. The gold basis tells us about this dynamic.
Conventional techniques for analyzing supply and demand are inapplicable to gold and silver, because the monetary metals have such high inventories. In normal commodities, inventories divided by annual production (stocks to flows) can be measured in months. The world just does not keep much inventory in wheat or oil.
With gold and silver, stocks to flows is measured in decades. Every ounce of those massive stockpiles is potential supply. Everyone on the planet is potential demand. At the right price, and under the right conditions. Looking at incremental changes in mine output or electronic manufacturing is not helpful to predict the future prices of the metals. For an introduction and guide to our concepts and theory, click here.
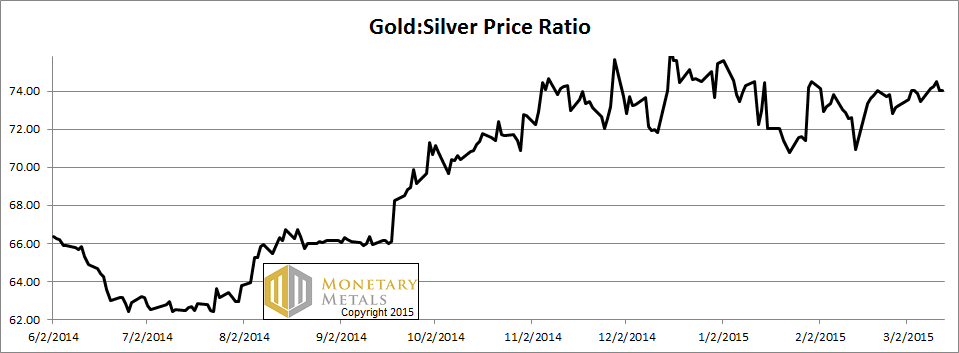
Next, this is a graph of the gold price measured in silver, otherwise known as the gold to silver ratio. It moved up a bit this week.
The Ratio of the Gold Price to the Silver Price
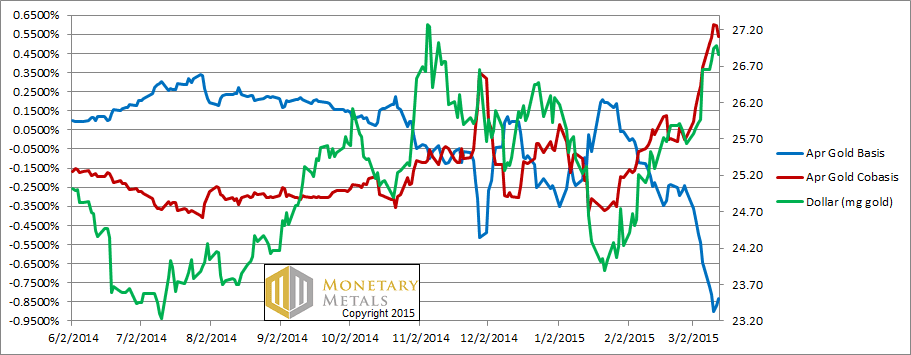
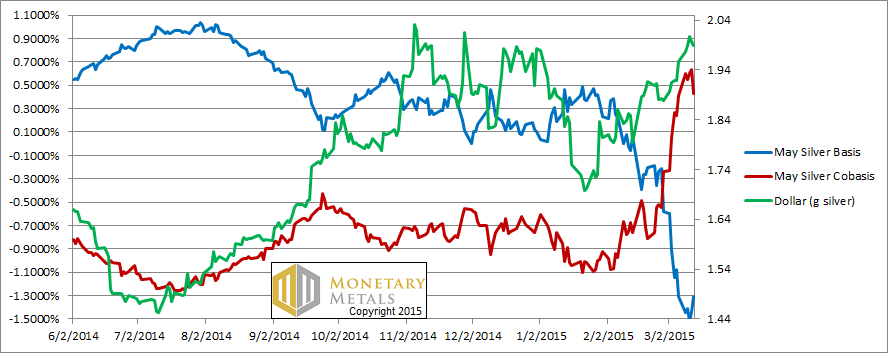
For each metal, we will look at a graph of the basis and cobasis overlaid with the price of the dollar in terms of the respective metal. It will make it easier to provide brief commentary. The dollar will be represented in green, the basis in blue and cobasis in red.
Here is the gold graph.
The Gold Basis and Cobasis and the Dollar Price
We said last week that this is a very interesting picture. It got even more interesting this week. Look at the near perfect correlation between the price of the dollar in gold (green) and the scarcity of gold indicator, the cobasis (red).
The fundamentals of the yellow metal are hardly changing. We calculate a fundamental price near $1,300 which is a few dollars higher than last week.
When the price changes but fundamentals do not, that’s the same as saying that speculators—typically using leverage—are moving the price in the futures market. In this case, they’re selling futures which pushes the price down but pushes the cobasis up. We now have a greater backwardation than last week. What’s more, the June contract is now within a few basis points of backwardation as well.
You should think of backwardation as a sign of shortage or scarcity. As the price of gold has been falling, supply of the metal has been drying up and/or demand is increasing.
Now let’s look at silver.
The Silver Basis and Cobasis and the Dollar Price
The picture is not so bullish in silver. 25 cents is a 1.6% drop. The cobasis blipped up but returned back to where it was. And the same for farther contracts.
We calculate a fundamental silver price near $15. If the silver price snaps as far below as it has been above, look for a handle with a 12 or maybe an 11 on it. This is not a prediction, but simply drawing symmetrical lines around the market price.
© 2015 Monetary Metals



You seem to be suggesting that the price of gold should be higher and the price of silver lower than they stand currently. Yet I thought that gold and silver prices move (and trend) in tandem. Are there any examples of when they have moved in opposite directions from each other (at least for any sustained period)? If so, presumably the reason was because of supply-demand fundamentals rather than sentiment?
@jasonww, Keith’s Au/Ag price ratio shows the recent curve of these metals’ deviation from pure “tandem” moves. Although a 9 month history is too brief to prove the point, you can see that the curve is not particularly flat. In the days of bimetallism (currency standards), the price ratio was in the 15-16x range, which derives from the ratios of their specific gravity (and hence the relative cost of shipment). Nowadays, industrial use of silver and massive hoarding of gold have altered that valuation. Cost of shipment is not an important criterion for their relative values. It is supply demand fundamentals as you suspect. Specifically these two have vastly different fundamental character, as silver has begun a centuries-long process of being demonetized for better or worse.
In fact, it is on this subject that Fekete himself has most altered his opinions, having offered more than one different reading of the same story. (“whither Gold?” being an early “conspiracy theory” version, and later essays backing off into more “organic” explanations).
Perhaps Keith will wade into those waters someday, but they seem murky to me, so I’d be cautious.
jasonww: The prices of gold and silver tend to move in the same direction but that is not necessarily so.
Greg: gold is not 16 times as heavy as silver (i.e. specific gravity). Its worth was 16 times greater (specific value), though of course today it is now 74X more valuable.
As to the demonetization of gold, I won’t wade into conspiracy waters. I can certainly agree that governments in the 19th century too actions to discourage the use of silver as money.
I stand corrected! The bi-metallism-era price ratios don’t seem to have any physical basis.
Shipping costs only set the gold and silver “points” (the spreads closed by shipments), it was the ratio of their spreads which correlated with their specific gravities, not their price ratio.
The breakdown of bimetallic currency standards (silver “demonetization”) was either (A) inevitable because price-fixing misuses the force of law, or (B) conspiratorial because everything legislated must be a conspiracy of some sort… Fekete does not tend to cite “public choice” arguments, so he has not yet offered a theory of legislatively-evolved money.
In any case, money-ness isn’t a binary (all or nothing) property. Gold “demonetizing” is a uniquely fruitless pursuit. Its goals and means are out in the open, though so it isn’t technically a conspiracy.
excellent reporting as usual
Question: When you use the April gold basis and cobasis on your chart, does the curve show April 2015 all along, or is the curve representative of the 1-month cobasis/basis
brgds