
Monetary Metals Supply and Demand Report: 16 Mar, 2014
The gold price went up this week, and the silver price went up a bit less. Several analysts said that speculators such as hedge funds were buying futures contracts this week and this is the harbinger of further increases in the price. Read on to see if this is true, and if so what it means…
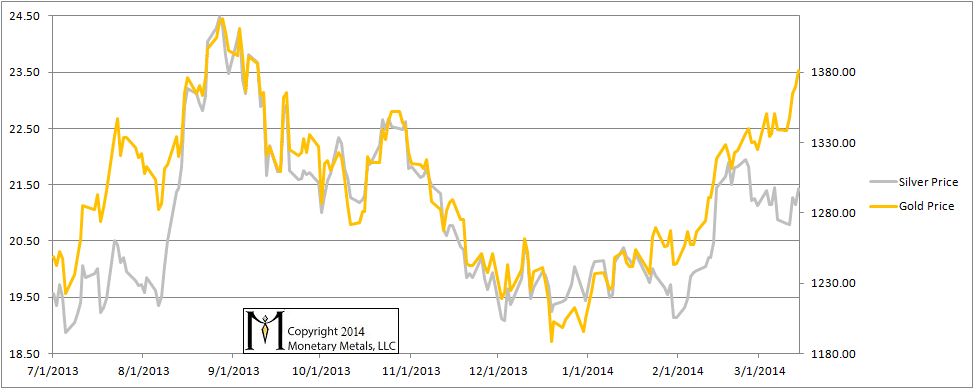
Here is the graph of the metals’ prices. The divergence in the prices of the metals is beginning to reflect the divergence in their fundamentals that we have been documenting for a long time. The gold price has made a new high for the move that has been developing since December. The silver price is below its recent high last month.
The Prices of Gold and Silver
We are interested in the changing equilibrium created when some market participants are accumulating hoards and others are dishoarding. Of course, what makes it exciting is that speculators can (temporarily) exaggerate or fight against the trend. The speculators are often acting on rumors, technical analysis, or partial data about flows into or out of one corner of the market. That kind of information can’t tell them whether the globe, on net, hoarding or dishoarding.
One could point out that gold does not, on net, go into or out of anything. Yes, that is true. But it can come out of hoards and into carry trades. That is what we study. The gold basis tells us about this dynamic.
Conventional techniques for analyzing supply and demand are inapplicable to gold and silver, because the monetary metals have such high inventories. In normal commodities, inventories divided by annual production can be measured in months. The world just does not keep much inventory in wheat or oil.
With gold and silver, stocks to flows is measured in decades. Every ounce of those massive stockpiles is potential supply. Everyone on the planet is potential demand. At the right price. Looking at incremental changes in mine output or electronic manufacturing is not helpful to predict the future prices of the metals. For an introduction and guide to our concepts and theory, click here.
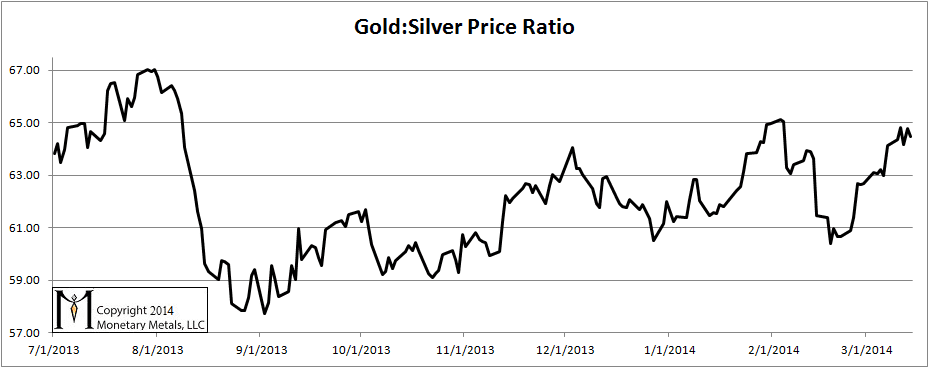
Here is a graph of the gold price measured in silver, otherwise known as the gold to silver ratio. The ratio rose 0.34 points, or half a percent.
The Ratio of the Gold Price to the Silver Price
Last week, we said:
“The data has been showing for a long time that, while supply and demand in gold is slightly tight, it’s loose in silver. Speculators are stretching the silver price higher by several dollars.”
After some discussion of collapsing currencies, we added:
“The whole point of using leverage to buy gold or silver futures is speculation. The speculators are trying to front-run the real buyers of the metals—the people who buy to take it home, and not sell regardless of price.”
Both the gold basis and silver basis show the evidence clearly. Speculators bought up futures contracts this week. What those analysts said is partly true. The very fact of speculative buying pushes up prices. But it is not necessarily a harbinger of higher prices.
It may herald higher prices, at times when the speculators are right. That is, the speculators correctly perceive that fundamental demand is picking up. The speculators are doing nothing more than trying to front-run the hoarders.
If the hoarders are not increasing their buying, then eventually the speculators stop borrowing more to buy more futures. And the price drops as they sell off, until the next cycle.
For each metal, we will look at a graph of the basis and cobasis overlaid with the price of the dollar in terms of the respective metal. It will make it easier to provide terse commentary. The dollar will be represented in green, the basis in blue and cobasis in red.
Here is the gold graph.
The Gold Basis and Cobasis and the Dollar Price
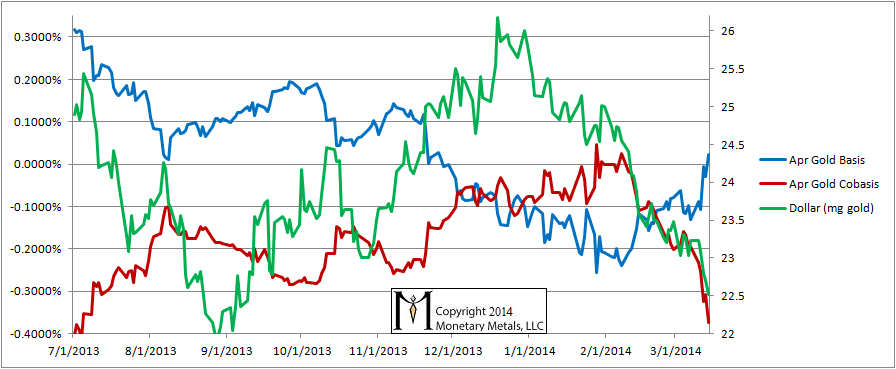
The cobasis dropped like a base metal brick! Here we are in the middle of March, and the April contract is already under heavy selling pressure a few weeks before first notice day. And despite this, the buying pressure on the April contract was great enough to push the cobais down to -0.40%. And the basis peeked up above zero—contango!—for the first time since November.
Now let’s look at silver.
The Silver Basis and Cobasis and the Dollar Price
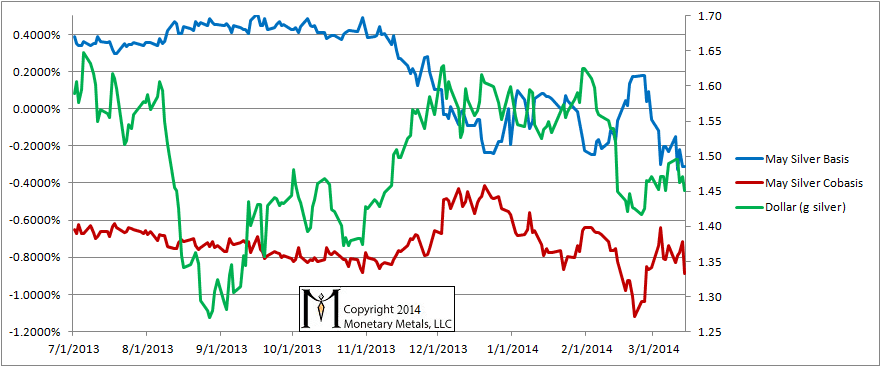
The silver cobasis dropped almost as much as the gold cobasis, though much less in proportion as the silver cobasis is so much lower in absolute level.
The silver basis also dropped, indicating widening bid-ask spreads in the futures market. There is both buying by speculators who might be thinking, “by golly if gold is going up a lot then silver is going to the moon!” There is also selling, perhaps by those who are anticipating further credit contraction.
This simultaneous buying and selling applies pressure to pry apart the spread. And for whatever reason, the market makers can’t keep the spread as tight as they used to.
© 2014 Monetary Metals
Keith,
SOrry but difficult to understand what you mean this time, you have a contango on gold which means what exactly (people are preferrng futures than spot) which is not a good sign for the price of gold no ?
Yes, it means futures are being bought, not a bullish signal for the gold price.
We have to be careful not to read into this too much and call this bearish just yet…
really strange that in such a moving international environment futures are preferred than the real stuff