
Monetary Metals Supply and Demand Report: 17 Aug, 2014
We have been bearish on silver in terms of its price measured in objective money—gold—for a long time. We have also expressed bearish opinions on silver as measured in terms of the US dollar.
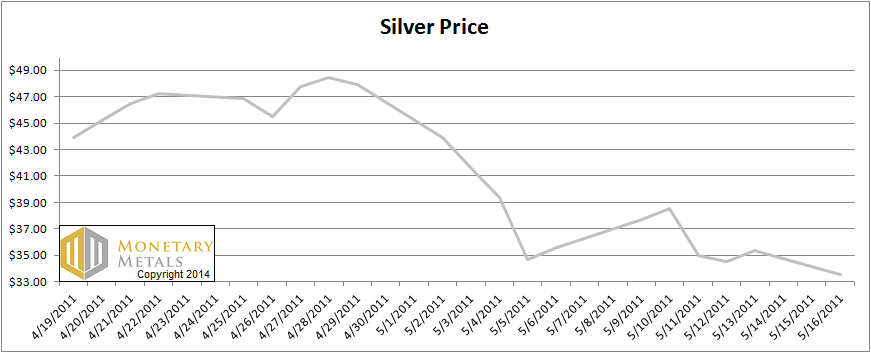
The current trend began on April 26, 2011. This was when the speculative silver bubble burst. On Monday April 25, the intraday high price was $49.83 but the price was $46.90 at the close. That’s almost $3. The price flitted around near the high for a few more days. But then the following Monday, it began to collapse. It closed that week at $35.58. Here’s a graph.
The Price of Silver Apr-May 2011
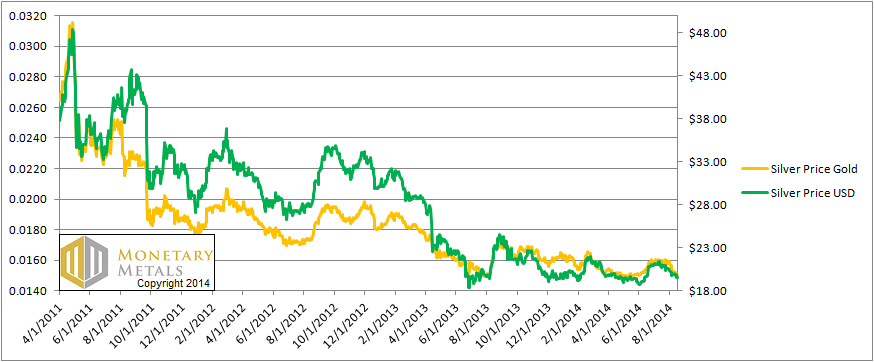
Since then, the trend has been down. The silver price in dollar terms is near its multiyear low. The same is true for its price in gold. Here is a graph from April 1, 2011. Both measures of the silver price look quite similar.
The Price of Silver in USD and Gold, Apr 2011 – Aug 2014
This week, the price of gold declined $5, and the price of silver fell $0.32. This occurred despite a price blip on Monday. Monday’s price action may have had something to do with two high-profile articles published that day promoting the profits to be had if one invests in speculates on silver.
There have been many zigs and zags to the silver price, even since its fundamentals got sharply weaker about a year ago. We suspect that the countertrend zigs are sometimes due to such promotions, and some are certainly due to Fed and unemployment announcements, as we have been documenting. The fundamentals will win in the end.
In gold, virtually all of the metal that has been mined for thousands of years is still in human hands. In silver, it’s a smaller percentage but still many decades of production at current mine output rates. Weakening fundamentals means that there are fewer buyers and more sellers of metal. Every price blip caused by the buying of futures encourages more sellers and discourages would-be buyers.
The fundamentals are definitely winning in silver.
To see a picture of the supply and demand fundamentals, read on…
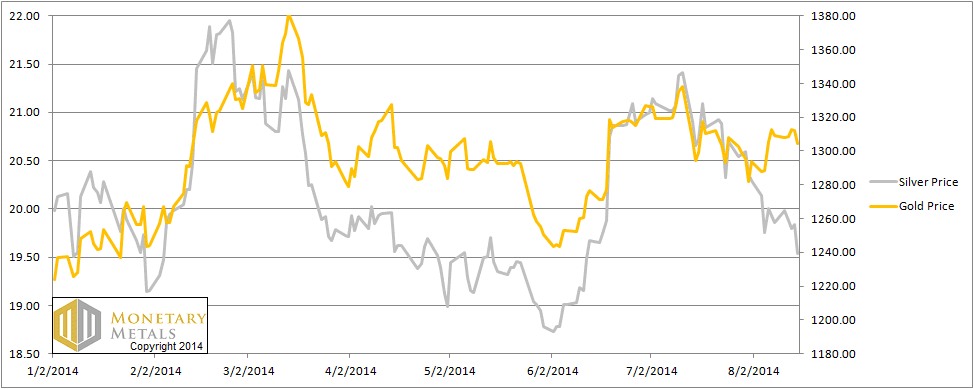
First, here is the graph of the metals’ prices.
The Prices of Gold and Silver
We are interested in the changing equilibrium created when some market participants are accumulating hoards and others are dishoarding. Of course, what makes it exciting is that speculators can (temporarily) exaggerate or fight against the trend. The speculators are often acting on rumors, technical analysis, or partial data about flows into or out of one corner of the market. That kind of information can’t tell them whether the globe, on net, hoarding or dishoarding.
One could point out that gold does not, on net, go into or out of anything. Yes, that is true. But it can come out of hoards and into carry trades. That is what we study. The gold basis tells us about this dynamic.
Conventional techniques for analyzing supply and demand are inapplicable to gold and silver, because the monetary metals have such high inventories. In normal commodities, inventories divided by annual production can be measured in months. The world just does not keep much inventory in wheat or oil.
With gold and silver, stocks to flows is measured in decades. Every ounce of those massive stockpiles is potential supply. Everyone on the planet is potential demand. At the right price. Looking at incremental changes in mine output or electronic manufacturing is not helpful to predict the future prices of the metals. For an introduction and guide to our concepts and theory, click here.
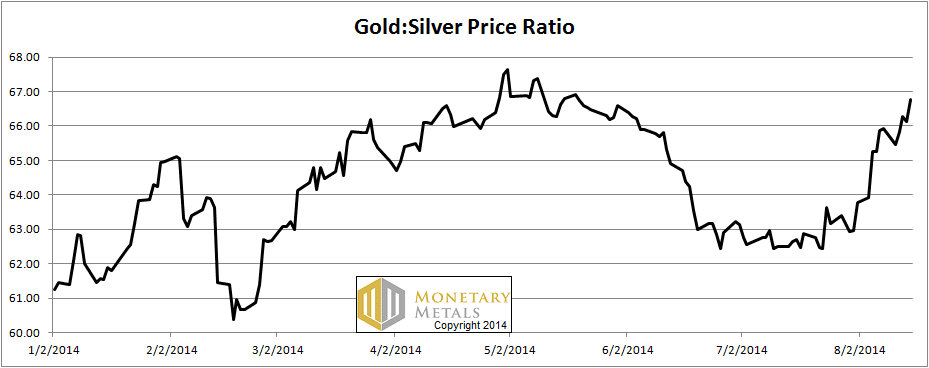
Next, this is a graph of the gold price measured in silver, otherwise known as the gold to silver ratio. The ratio rose this week, from 65.86 to 66.76, or 1.4%.
The Ratio of the Gold Price to the Silver Price
For each metal, we will look at a graph of the basis and cobasis overlaid with the price of the dollar in terms of the respective metal. It will make it easier to provide terse commentary. The dollar will be represented in green, the basis in blue and cobasis in red.
Here is the gold graph.
The Gold Basis and Cobasis and the Dollar Price
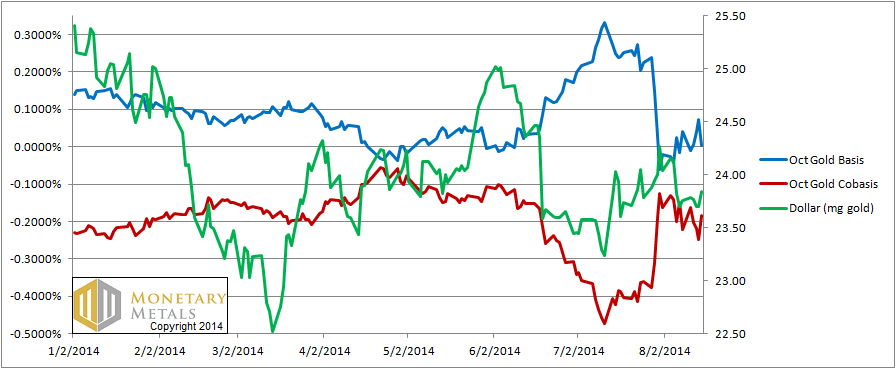
The cobasis (i.e. scarcity) and the dollar price (i.e. inverse of the gold price measured in dollars) continued their tight correlation for another week. Prices moves continue to be driven by speculators repositioning themselves.
Now let’s look at silver.
The Silver Basis and Cobasis and the Dollar Price
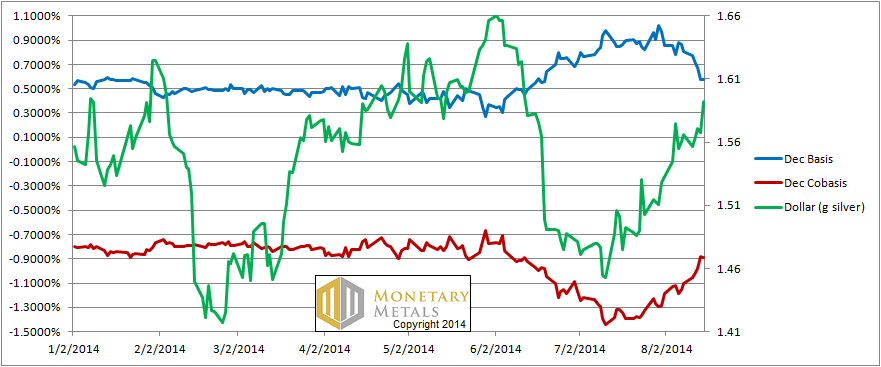
We have shifted from the September to the December contract, as the contract “roll” (i.e. when silver speculators must sell their September contracts before First Notice Day and buy December or another farther-out contract if they wish to remain long) is well under way, and making the September basis volatile.
In silver, we have the same story as with gold. The difference is that the absolute level of the cobasis is -0.89% (vs. -0.25% for the December gold cobasis).
Don’t be misled by the scales of the dollar price and the scale of the cobasis. On June 12, the dollar was 1.6g and the cobasis was -0.8877%. The dollar dropped and rose again. Now the dollar is 1.59g and the cobasis is -0.8876%.
This is a perfect picture of speculators’ repositioning. As they sell futures, silver becomes scarcer in the market. As they buy futures, silver becomes more abundant again. After two months of back and forth, the market is back to the same state.
© 2014 Monetary Metals

Brilliant. Simply brilliant
Hi Keith.
Does the fact that your basis/co-basis analysis heavily relies entirely on the COMEX contracts introduce some risk of distortion?
There are a number of people and organizations that allege the Federal Reserve and bullion banks are manipulating the COMEX prices by selling unbacked contracts, as well as a longer terms process of leasing central bank gold to bullion banks who have sold it into the jewelry markets.
I don’t know how true these allegations are. I certainly don’t see how one could sell unbacked contracts without having to deliver or else buy them back when they come due.
But, if the central banks have leased or sold several thousand tonnes of gold into the markets over the past two decades, that is also listed on the balance sheets of those banks/countries as reserving their currency, wouldn’t that set up the conditions for a massive short squeeze on gold?
James Turk argues that gold has gone into backwardation because the market prices have been manipulated to be significantly below the real demand for physical gold.
The Bank of India reported that the ratio of physical to paper claims on gold is 1:98, which would seem to provide some official substantiation to these claims.
Your co-basis analysis seems to work very well at predicting short term COMEX movement. But does it take into account the fact that the Federal Reserve can sell unlimited gold contracts, and then print unlimited dollars to buy them back at the lower price, or if necessary at a higher price?
If, as some allege, there is some kind of fraud or manipulation underlying the COMEX it seems likely that this could result in a very non-linear results that were not predicted by the basis/co-basis analysis.
Your algorithm seems to provide accurate predictive results, but no algorithm can give valid results when fed invalid data. I’m questioning the long-term validity of the COMEX data.
kendo: The whole point of the basis analysis is to look at the spread between spot and future. If someone were to sell large numbers of futures contracts they could push down the price of the futures contract. Suppose they pushed down the future $100. There would be a $100 backwardation. I would be standing on the rooftops bellowing at the top of my lungs if such an unprecedented thing occurred.
I am well aware of the claims of manipulation. I have written an substantial body of work (all of it published on this site) analyzing every aspect of it: warehouse stocks, GLD stocks, the events of Apr 12-15 2013, China, etc. If you’re interested, I recommend you browse through the site going back, page by page of the blog, to around Feb 2013.
The issue is not whether a contract is sold “unbacked”, i.e. without a bar sitting in the warehouse. A gold miner may sell a contract and it will have the gold by the time the contract matures. Or a bank may lease gold out for 6 months and sell a future that matures in 6 months. So you cannot count contracts and compare to bars in the COMEX warehouses.
Many people define backwardation as a negative GOFO. I think that is a rough approximation. It will get you in the right ballpark. For more precision, one must compare the bid on spot to the ask on the future. This is the actionable trade in the market. I wrote an article on negative GOFO and backwardation, it’s in the blog archives.
I hope this helps.
What drives Negative GOFO and Temporary Gold Backwardation
and
Why is Gold Draining Out of COMEX Warehouses?
may be the best explanations of the underlying logic.
Outright frauds aside, the logical possibility of massive manipulation in the monetary metals market would tend to sabotage the widely-held hope that future monetary standards could be based on gold because of its inherent stability. I find that Keith’s views come from the direction of “you can’t fool Mother Nature” i.e. the market sees through all agendas and the forces that recognize gold as money are simply too fundamental to be easily undermined.