Monetary Metals Supply and Demand Report: 17 May, 2015
On Wednesday, retail sales data was published. The numbers were disappointing, and markets roiled. The prices of gold and silver shot up. There was no looking back and both metals ended at their high prices for the week. The euro also jumped up, about a cent and a quarter.
Now, of course, gold analysts are talking about the gold and silver breakouts. We, of course, are interested in what’s really happening in the supply and demand fundamentals. Speculators, of course, can move the price for a while. However, they cannot sustain a move. They are trying to front-run real demand for real metal by long-term holders, such as coin “stackers” and jewelry buyers.
So which is it? Did jewelry demand buck the weak sales in other retail categories? Did coin stackers add to their piles? Or was it speculators—acting on the theory that weak sales means the Fed will have to postpone its plan to raise interest—levering up their bets on futures?
Read on for the only accurate picture of supply and demand in the monetary metals markets…
First, here is the graph of the metals’ prices.
We are interested in the changing equilibrium created when some market participants are accumulating hoards and others are dishoarding. Of course, what makes it exciting is that speculators can (temporarily) exaggerate or fight against the trend. The speculators are often acting on rumors, technical analysis, or partial data about flows into or out of one corner of the market. That kind of information can’t tell them whether the globe, on net, is hoarding or dishoarding.
One could point out that gold does not, on net, go into or out of anything. Yes, that is true. But it can come out of hoards and into carry trades. That is what we study. The gold basis tells us about this dynamic.
Conventional techniques for analyzing supply and demand are inapplicable to gold and silver, because the monetary metals have such high inventories. In normal commodities, inventories divided by annual production (stocks to flows) can be measured in months. The world just does not keep much inventory in wheat or oil.
With gold and silver, stocks to flows is measured in decades. Every ounce of those massive stockpiles is potential supply. Everyone on the planet is potential demand. At the right price, and under the right conditions. Looking at incremental changes in mine output or electronic manufacturing is not helpful to predict the future prices of the metals. For an introduction and guide to our concepts and theory, click here.
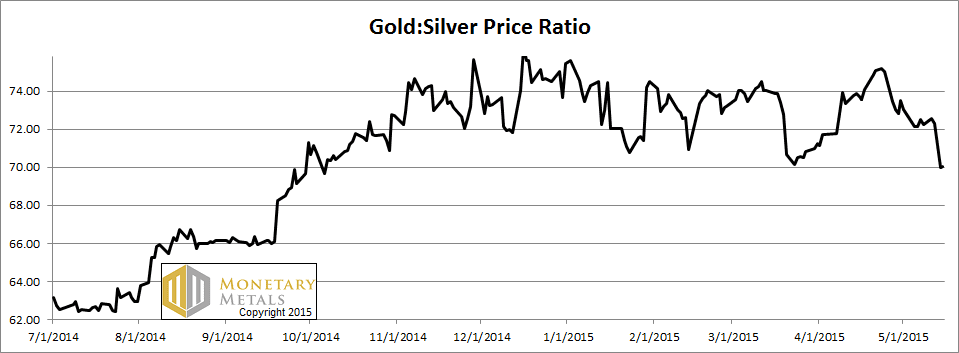
Next, this is a graph of the gold price measured in silver, otherwise known as the gold to silver ratio. It moved down sharply this week.
The Ratio of the Gold Price to the Silver Price
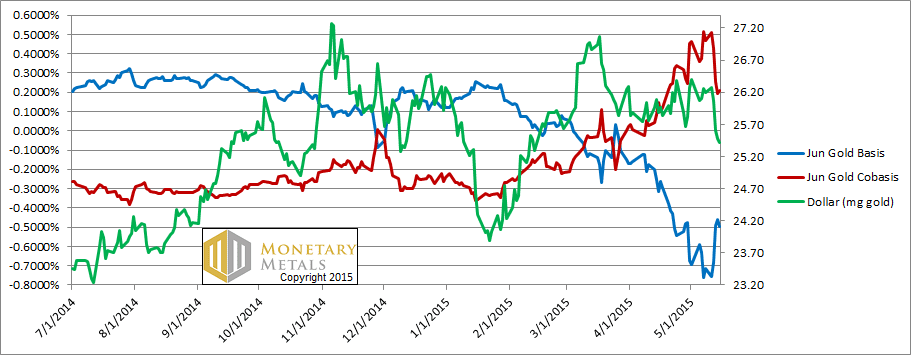
For each metal, we will look at a graph of the basis and cobasis overlaid with the price of the dollar in terms of the respective metal. It will make it easier to provide brief commentary. The dollar will be represented in green, the basis in blue and cobasis in red.
Here is the gold graph.
The Gold Basis and Cobasis and the Dollar Price
Note the falling red cobasis line (i.e. scarcity). As the price of gold rose, the scarcity fell. Remember, this graph does not show the price of gold measured in dollars. It shows the inverse, i.e. the price of the dollar, measured in gold.
On Monday, the cobasis had been as high as +50 basis points. It is now +21. This is notable as the June contract is under heavy selling pressure (which is an upward force on the cobasis), due to the need to sell or roll it before First Notice Day.
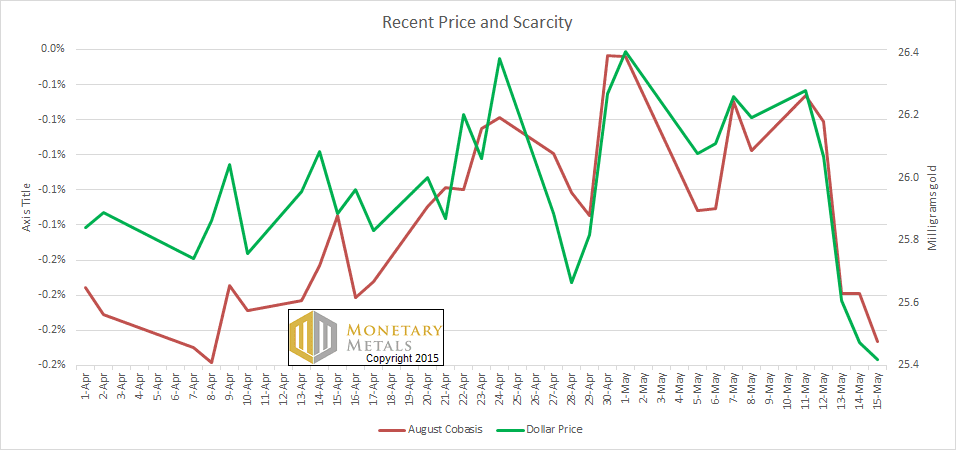
To see it more clearly, let’s zoom in to just April and May. And for good measure, we’ll use the cobasis from the August contract.
Close-up of Gold Price and Scarcity
The price of the dollar rose on Monday, closing at 26.3mg gold. Then it fell every day thereafter, with the big move on Wednesday of almost half a milligram. Our measure of scarcity tracked it with an uncanny tenacity. It turned out that there is absolutely no reason for gold to go up (as most people conceive it) when retail sales underperform expectations. Leveraged speculators may hit the buy button with abandon, but metal hoarders not so much.
To answer the question posted in the introduction: the buying on Wednesday wasn’t coin hoarders stacking. It was leveraged futures buyers speculating.
The fundamental price didn’t budge this week.
Now let’s look at silver.
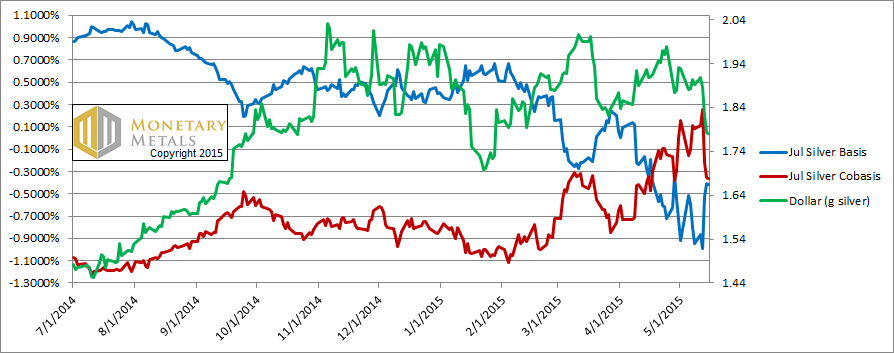
The Silver Basis and Cobasis and the Dollar Price
The silver story is pretty much the same as in gold. Speculators pushed up the price of futures. With the higher price, there is rising abundance and falling scarcity.
To put it in perspective, the July silver contract had shown a little backwardation last week and through Tuesday. By Friday, it fell to -36 basis points.
Silver’s fundamental price did go up about half a buck this week. However, the market price went up over a dollar. The price could fall a lot, though a little bird is whispering that it isn’t likely to be this week. Who knows, maybe this rally will have legs. It’s even possible that a rising price will stoke demand for real metal, if hoarders begin to worry that now is the time to get it while it’s cheap.
In the meantime, the best advice we can give us to sit this one out. We do not see a good balance of risk and reward here.
© 2015 Monetary Metals


Keith, you’re no fun.
I try! :)
What causes the fundamental price to hover for months $50 to $100 above the quoted price? Distorted interest rates?