
Monetary Metals Supply and Demand Report: 2 Feb, 2014
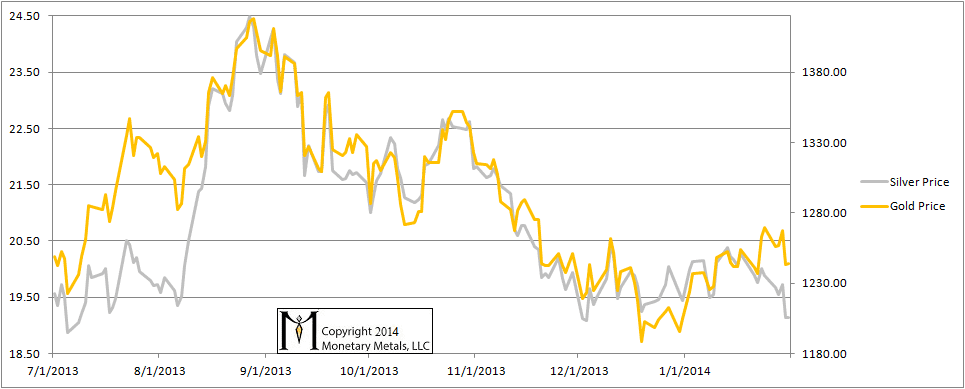
The dollar rose half a milligram this week, to 25mg (or, if you still believe the dollar is money, the price of gold fell from $25 to $1244). In silver terms, the dollar rose nearly 4%, to 1.62g. Is this it? The dollar’s terminal fall? Read on…
Here is the graph of the metals’ prices.
The Prices of Gold and Silver
We are interested in the changing equilibrium created when some market participants are accumulating hoards and others are dishoarding. Of course, what makes it exciting is that speculators can (temporarily) exaggerate or fight against the trend. The speculators are often acting on rumors, technical analysis, or partial data about flows into or out of one corner of the market. That kind of information can’t tell them whether the globe, on net, hoarding or dishoarding.
One could point out that gold does not, on net, go into or out of anything. Yes, that is true. But it can come out of hoards and into carry trades. That is what we study. The gold basis tells us about this dynamic.
Conventional techniques for analyzing supply and demand are inapplicable to gold and silver, because the monetary metals have such high inventories. In normal commodities, inventories divided by annual production can be measured in months. The world just does not keep much inventory in wheat or oil.
With gold and silver, stocks to flows is measured in decades. Every ounce of those massive stockpiles is potential supply. Everyone on the planet is potential demand. At the right price. Looking at incremental changes in mine output or electronic manufacturing is not helpful to predict the future prices of the metals. For an introduction and guide to our concepts and theory, click here.
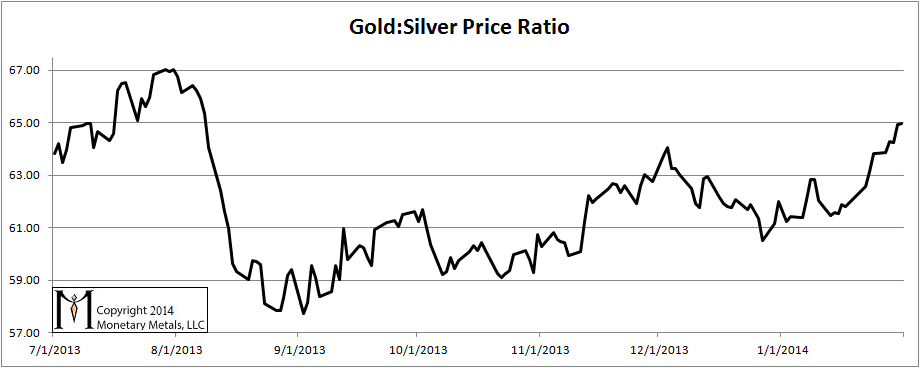
Here is a graph of the gold price measured in silver, otherwise known as the gold to silver ratio. It rose again this week, another 1.8%. It appears to be moving towards the high so far set at the end of July.
The Ratio of the Gold Price to the Silver Price
For each metal, we will look at a graph of the basis and cobasis overlaid with the price of the dollar in terms of the respective metal. It will make it easier to provide terse commentary. The dollar will be represented in green, the basis in blue and cobasis in red.
Here is the gold graph. As the February contract is now past First Notice Day, we are looking at the April future.
The Gold Basis and Cobasis and the Dollar Price
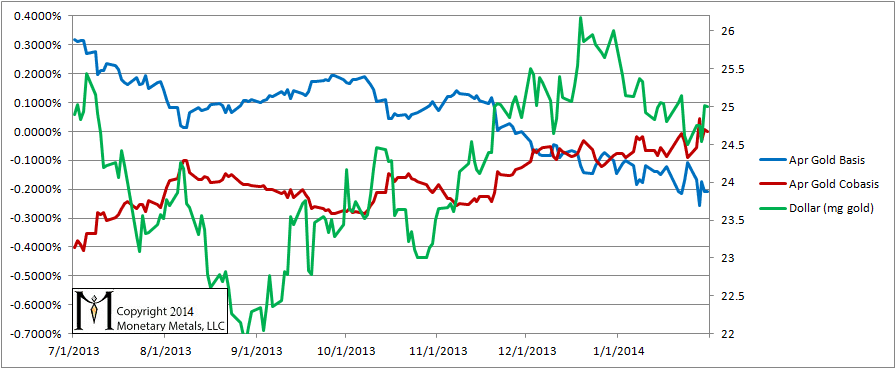
The April contract peeked into backwardation one day this week, and the cobasis ended the week exactly at zero.
We continue to read about the supposed divorce between the price of paper gold and the “demand” of physical. Leaving aside that this is a meaningless comparison, like the price of apples and the taste of oranges, we may be watching a new picture emerge in gold demand, though it’s too early to tell. In light of a falling dollar, the cobasis may be firming up. If so, that may be some good news for the gold bugs, as it would be a signal of a higher gold price to come.
Now let’s look at silver.
The Silver Basis and Cobasis and the Dollar Price
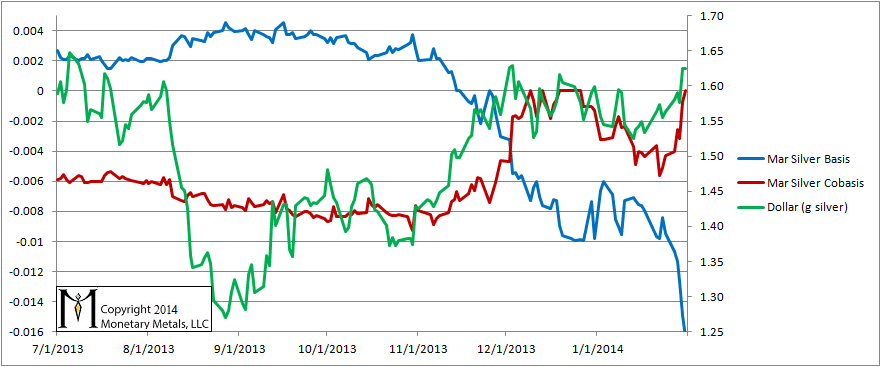
The dollar price went up in silver terms, and so did the silver cobasis (now zero). Speculators sold off a bit. They have reason to be worried, as there are very serious things brewing in credit-land. Of all the ways to quantify just how sensitive the silver price is to credit conditions, being long with 4X leverage may not turn out to be the best one.
Interestingly, the basis fell significantly farther than the cobasis rose. Once again, we may be looking at a widening bid-ask spread in the silver futures market. We’ll keep tracking the data and report back next week.
© 2014 Monetary Metals

Leave a Reply
Want to join the discussion?Feel free to contribute!